

Spill Baby Spill: how to read the opportunity trapped in curtailment
For generators, curtailment tends to be viewed simply as energy that could have been produced but wasn't. Lost megawatt-hours, lost revenue.
This is the accounting view. Investors should see something different.
Curtailment is information for capital. It shows where the market has excess energy, insufficient flexibility, and value waiting to be captured.
Renewable curtailment* across Australia’s National Electricity Market (NEM) increased from 1.3 TWh in 2020 to 7.4 TWh in 2025. For context, 7.4 TWh is enough to power all of South Australia for an entire year.
While the NEM-wide number are arresting, the real story emerges at the state level.
South Australia (SA) and Victoria continue to curtail the most energy, reflecting high renewable penetration and increasingly constrained midday conditions, predominantly driven by oversupply of solar (rooftop and grid-scale) and coincidental wind. Other regions are moving in the same direction, albeit at different speeds.
What matters is curtailment is becoming more predictable. This is what transforms curtailment from an operational problem into an investment signal.
The midday problem
Annual curtailment data reveals how much energy is being spilled, but tells us far less about when these spills are occurring.
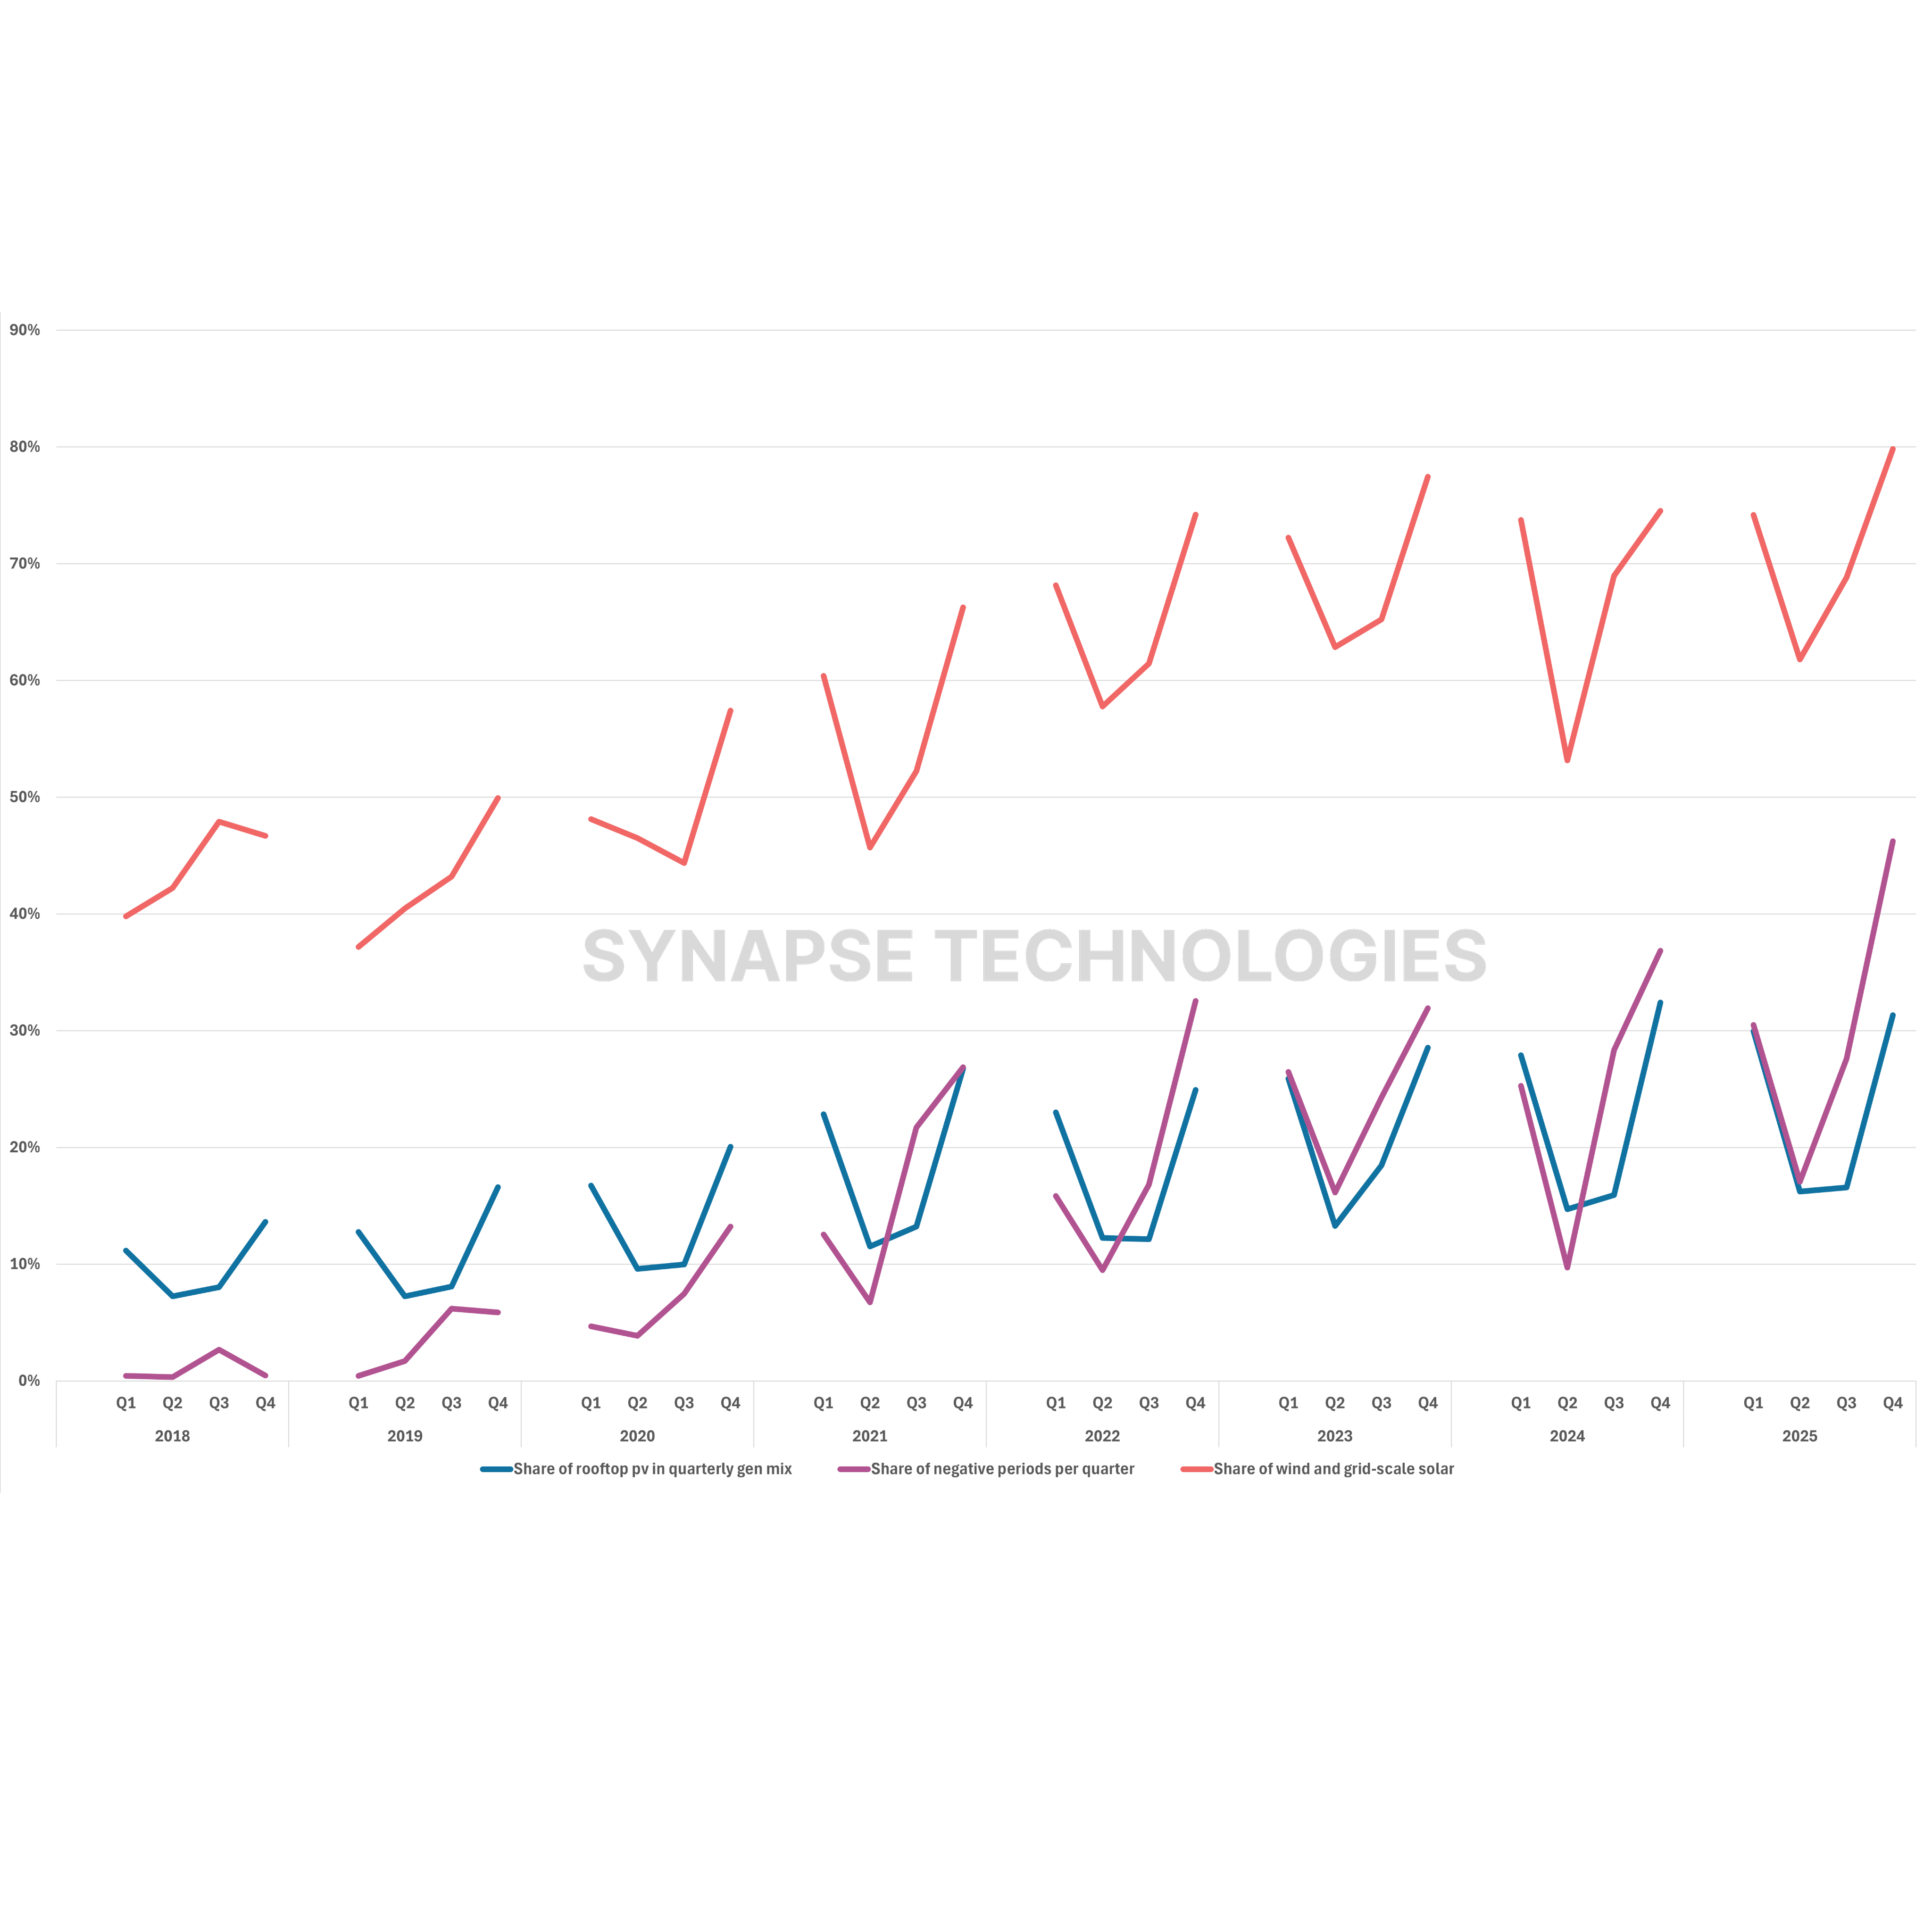
Figure 1 shows total curtailed energy alongside curtailment rates for each mainland state by time of day between 2020 and 2026. The picture is remarkably consistent – curtailment has been growing and is at its worst around midday. SA provides perhaps the most striking example.
SA’s renewable curtailment rate in 2025 was 73% at 1PM, while the rest of the mainland NEM was at 32%. This means 73% of all renewable energy available at 1PM in SA in 2025 was effectively wasted, bringing neither revenues to the generator nor green electricity to households.
Was this energy truly surplus to need, or was it valuable but tragically stranded in the wrong hour?
The Curtailed Flexibility Dividend
To answer this question, Synapse Technologies has developed a measure we call the Curtailed Flexibility Dividend.
The concept is simple: for every megawatt-hour curtailed between 10AM and 1PM, we calculated the revenue that the energy would have earned at the prevailing regional price and compared it to the revenue it could have earned if it had been stored and discharged during that same day's evening peak between 5PM and 8PM, adjusted for battery efficiency losses. The difference between those two is the Curtailed Flexibility Dividend.
In effect, it measures the opportunity cost of not being able to move curtailed energy through time.
We used the average evening peak price rather than the highest interval price to deliberately temper the result. If large volumes of curtailed energy had actually been shifted into the evening peak, prices would have likely been lower than what was actually observed on those days. The objective is not to estimate perfect arbitrage revenue, but to get a read on the value embedded in curtailed energy.
Importantly, not every curtailed megawatt-hour can be captured. Some volumes sit behind network constraints that may be difficult to get around.
But that is not the point. What the Curtailed Flexibility Dividend tries to measure is whether significant curtailment was occurring on days where that energy could have been valuable. Volatile days with significant spreads.
Figure 2 shows that opportunity expanded materially between 2020 and 2025. Across the mainland NEM, the Curtailed Flexibility Dividend increased from $27 million in 2020 to $328 million in 2025 (AUD).
This suggests that energy was not only being curtailed on low-value days with abundant electricity from sunrise to sunset, but that, increasingly, energy was being curtailed on days when there was, in fact,meaningful volatility.
In other words, the market was not just spilling excess energy, but leaving valuable energy stranded at the wrong hour.
The regional data demonstrates this point.
Queensland and New South Wales accounted for the largest shares of the Curtailed Flexibility Dividend, with Queensland sitting at $94 million in 2024 and $115 million in 2025, while New South Wales recorded $95 million in 2025.
Looking at these figures in isolation can be misleading though. High curtailment alone doesn’t create opportunity. It only becomes valuable when curtailment coincides with volatility and strong evening pricing.
Once the Curtailed Flexibility Dividend is adjusted (weighted) by curtailed volume, a different picture emerges.
In 2025, Queensland recorded a volume-adjusted Curtailed Flexibility Dividend of almost $400/MWh, far exceeding every other mainland region. South Australia and Victoria followed at $93/MWh and $90/MWh respectively, while New South Wales recorded just $51/MWh, even though the state’s absolute dividend was one of the largest.
This distinction between absolute and volume-adjusted matters.
Absolute dividends identify where the largest pools existed. Volume-adjusted dividends reveal where each curtailed megawatt-hour carried the greatest value.
Viewed through this lens, Queensland's curtailed energy up to 2025 was not only plentiful, but frequently occurred on days where the market made flexibility exceptionally valuable. South Australia and Victoria, while smaller in aggregate, also exhibited strong value density, suggesting curtailment in those regions coincided with high evening prices.
Taken together, the data suggests that by 2025 the potential value in time-shifting curtailed energy had both deepened and broadened. The opportunity was no longer confined to a handful of isolated events but had become an increasingly visible feature across multiple mainland regions.
Capturing that value, however, required more than simply being present. The opportunity remained highly location-dependent, favouring assets and portfolios positioned where curtailed volumes, network conditions and flexibility value consistently overlapped.
Are batteries already changing the picture?
The rapid build-out of batteries across Queensland (currently ~3 GW of max power) and New South Wales (~2.5 GW) provides an early test.
While it is still too early to draw definitive conclusions, the initial evidence suggests batteries are indeed changing the landscape.
In Queensland, curtailment rates fell from 13% in 2025 to just 5% in May 2026, while the Curtailed Flexibility Dividend dropped to just $10 million – the largest decline of any mainland region. Although still premature for definitive calls, the combination of lower curtailment and lower flexibility value suggests the growing battery fleet may already be capturing some of the value previously embedded in curtailed energy. This may be an early sign that together with grid-scale BESS, behind-the-meter batteries are beginning to compress flexibility value, including through the Cheaper Home Batteries Program as we covered in Volume One.
That said, 2026 has not yet fully captured winter peak volatility or spring curtailment conditions. We will have to wait for the full picture.
The next chapter
The next chapter of the curtailment story may not be written by generators alone, but co-written by energy-hungry data centres.
Last week, computing infrastructure company Iren announced plans to build an 800 MW data centre about 125 km northeast of Adelaide. It is unlikely to be the last.
As large loads connect to the grid, and coal fire stations retire, the value of curtailed energy is likely to increase.
As curtailment becomes an increasingly important feature of the NEM, understanding where opportunities exist – and how they interact with the rest of a portfolio – will become a source of competitive advantage.
The winners will not necessarily be those who build the most batteries. Rather, they will be those who understand where curtailed energy exists, where flexibility is most valuable, and where those two conditions overlap.
These are exactly the types of signals Amplink was built to uncover. The modelling platform enables granular understanding of intersections, like how curtailment, flexibility value, network constraints and portfolio exposure combine to create investable opportunities.
In a market increasingly defined by renewable abundance, the challenge is no longer finding cheap energy, but holding onto the value hidden inside it.
* We have not distinguished system curtailment from economic curtailment as curtailment in this analysis represents all observed curtailed renewable energy, irrespective of whether the underlying driver was economic, network or system-related. The objective is to assess the value embedded within curtailed volumes rather than attribute causality.

.png)