

Sun’s out, load’s gone: the evolution of NEM demand
South Australia is about to reach parity between rooftop solar capacity and peak load – a globally unprecedented scenario. And other Australian states are on a similar trajectory, hurtling Australia’s National Electricity Market (NEM) towards new territory.
Backstory
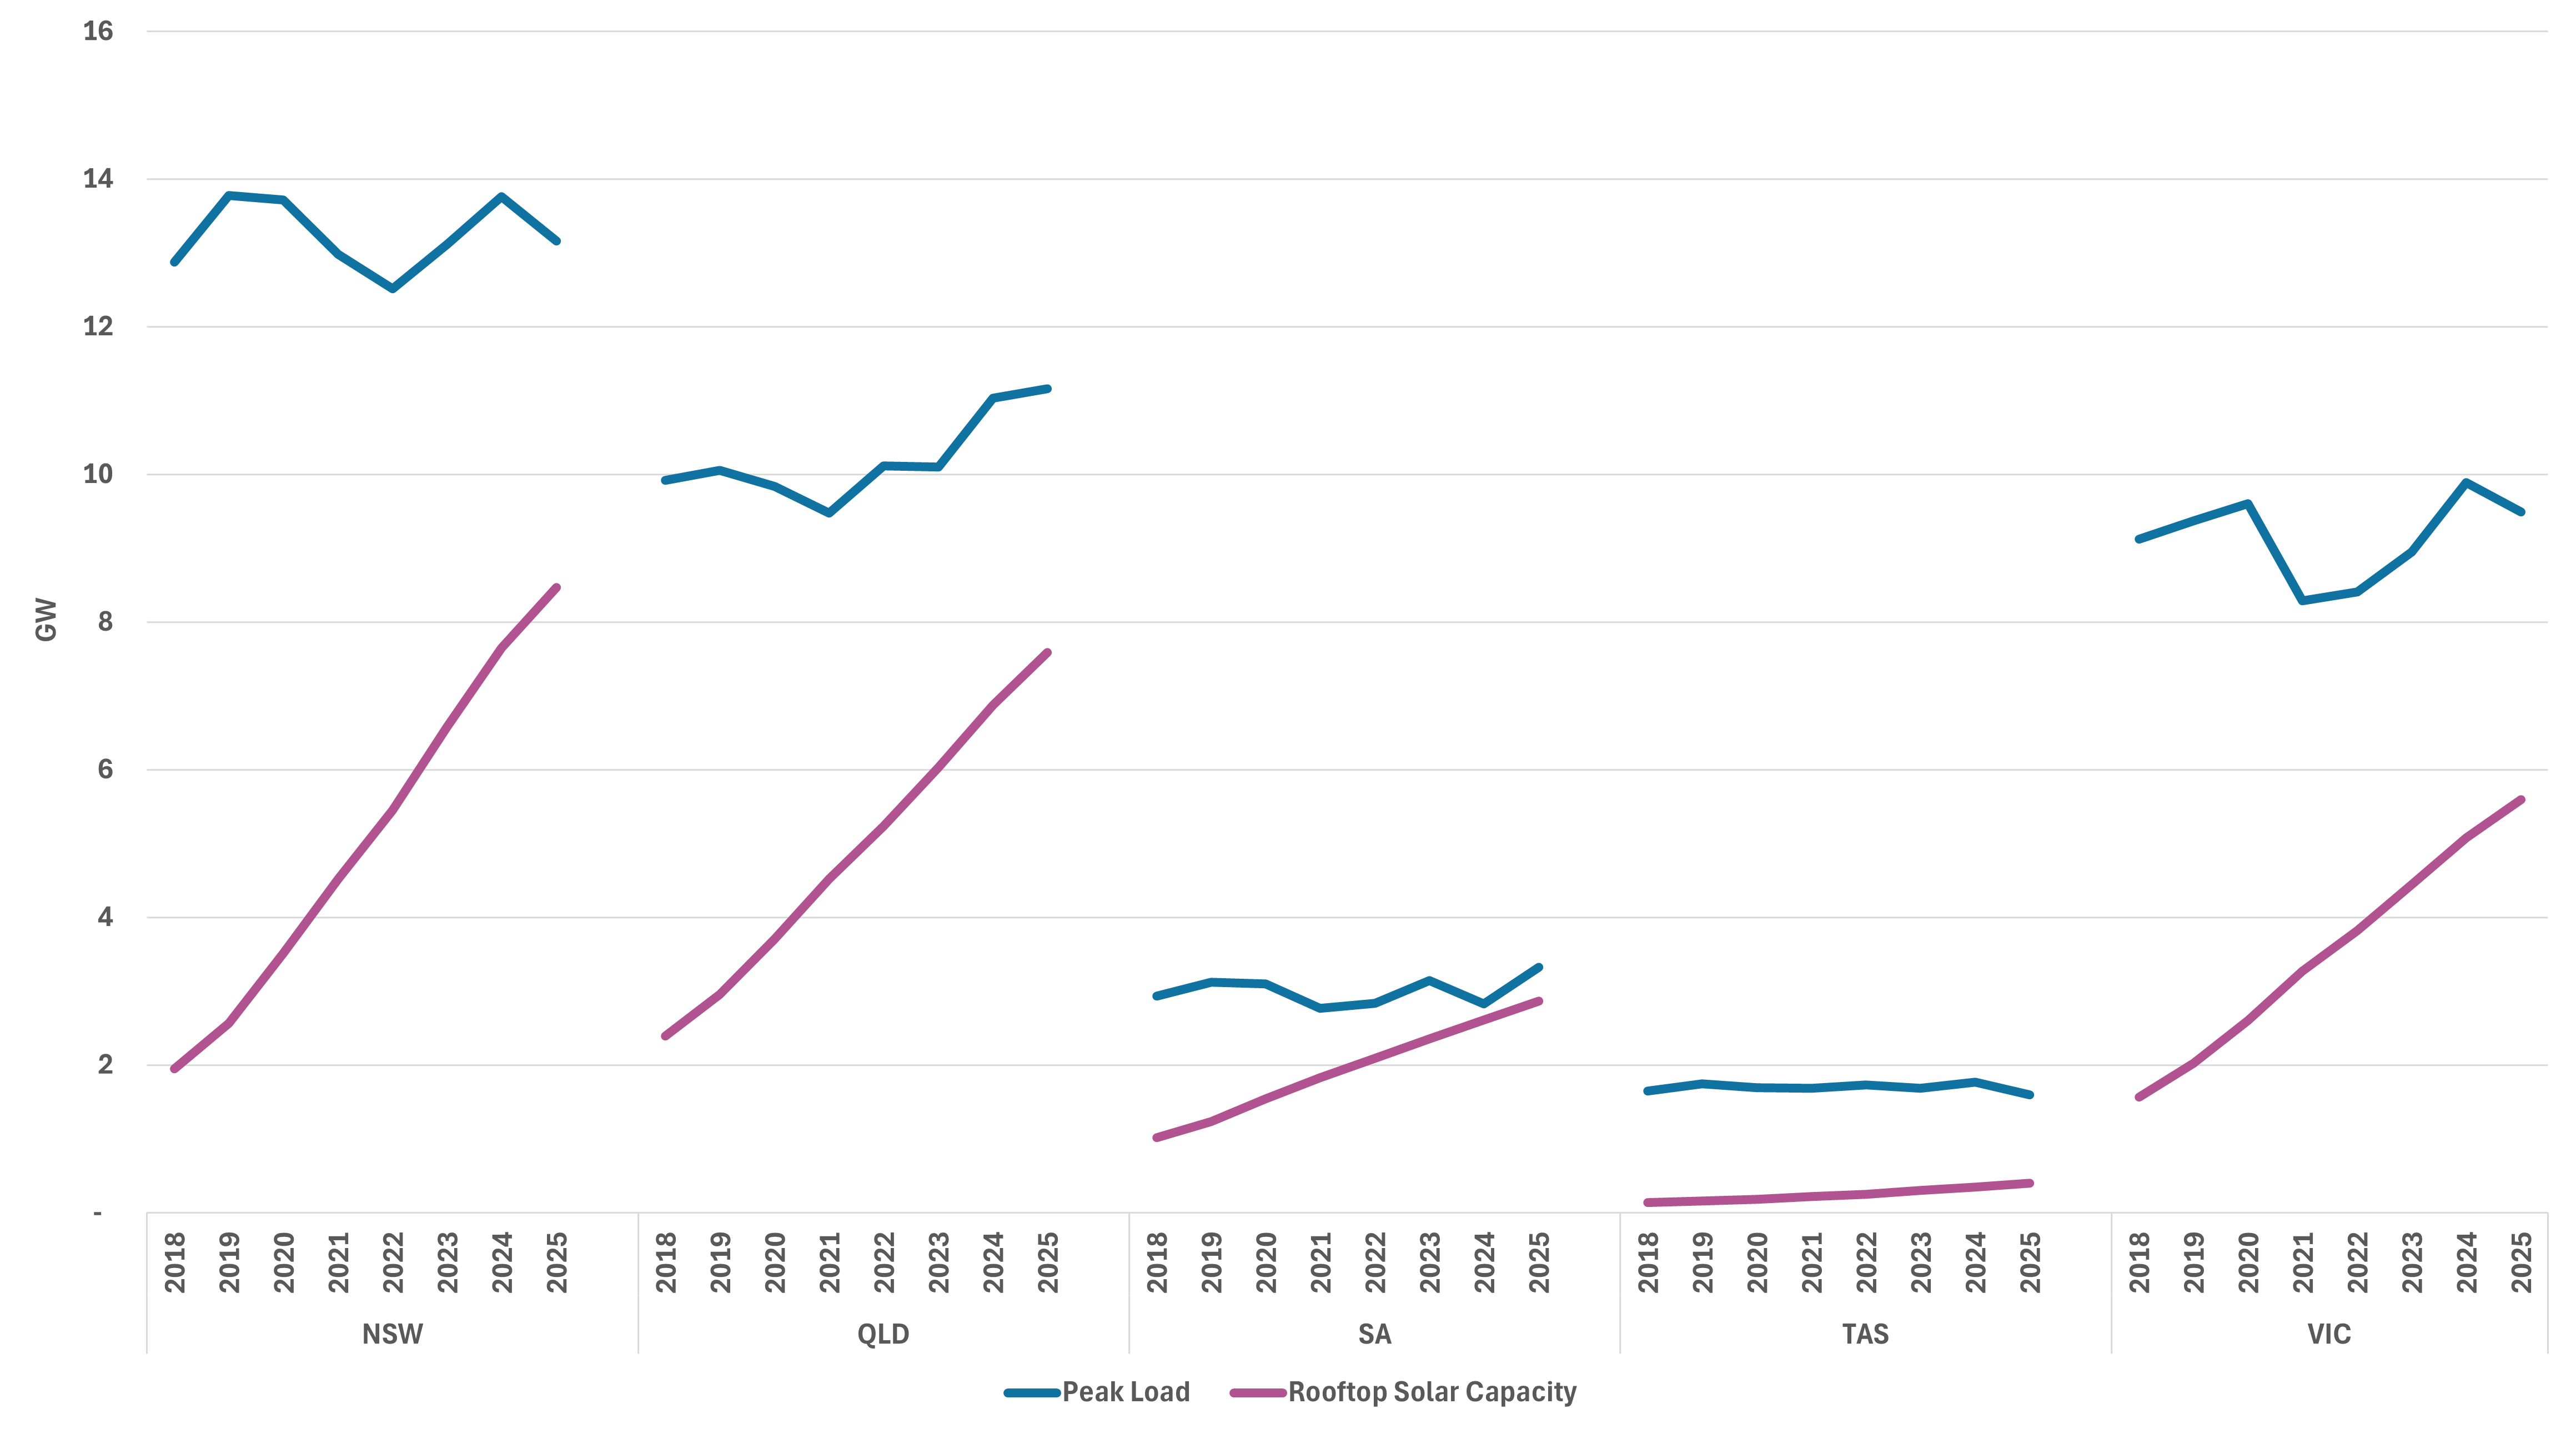
Rooftop solar has more than tripled in the last seven years, growing from approximately 7 GW in 2018 to 25 GW in 2025 across all NEM states. It is the single largest electricity source in Australia by installed capacity, with the nation steadily leading the world in solar per capita. Meanwhile, peak demand in the NEM has remained relatively even, bar a modest jump in Queensland.
In New South Wales (NSW) and Queensland, rooftop solar capacity now represents roughly 60 - 70% of peak load. In South Australia (SA), it is closer to ~90%. Of course, peak rooftop generation and peak demand occur at different times of the day, which is highly consequential for flexibility needs but more on that later. Nonetheless, at this scale, rooftop solar is no longer simply contributing energy – it is actively reshaping demand; dictating dispatch, pricing, and investment decisions; and creating ever-deeper ramp dynamics.
The structural changes effected by rooftop solar are clear when we look at how demand has shifted throughout the day. Figure 2 charts the difference in intraday demand (average) between 2018 and 2025, showing a pattern of hollowed out demand during daylight followed by a steep swing into the evening peak across all mainland states.
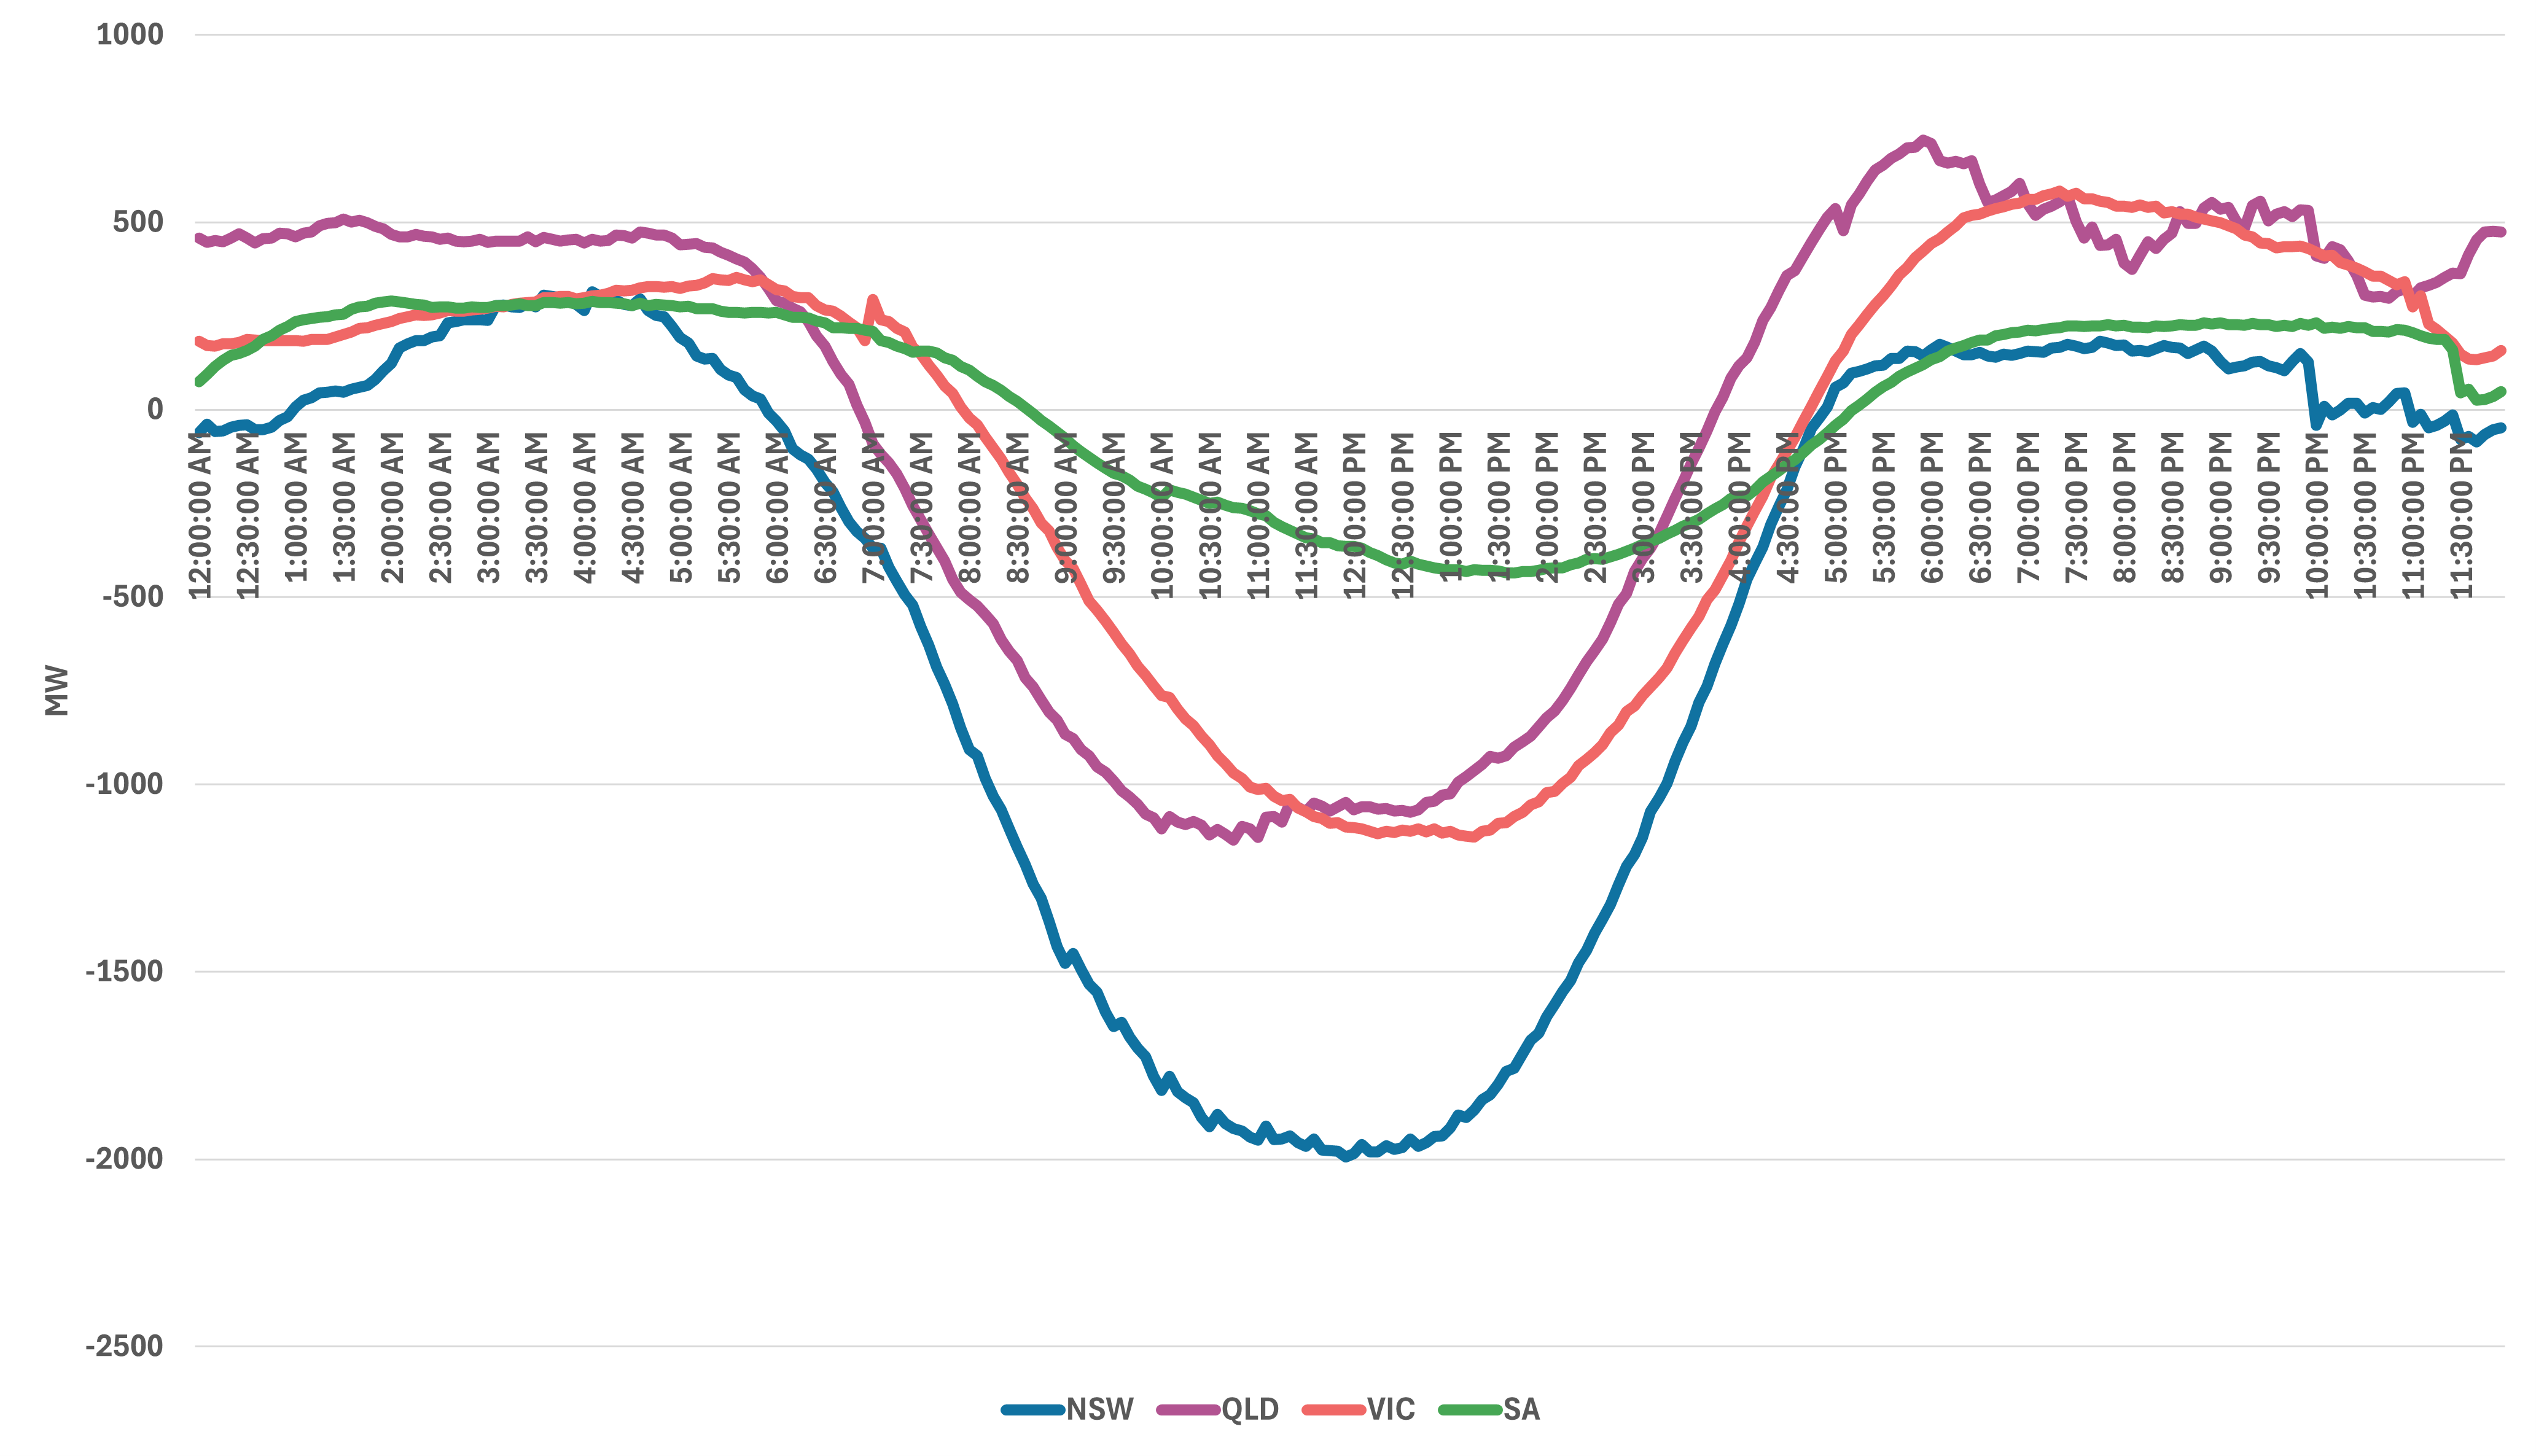
Midday demand has fallen by ~0.3 GW in South Australia and as much as 2 GW in NSW. This energy has not disappeared, it is still being consumed, but it is now generated behind-the-meter and therefore invisible to the market.
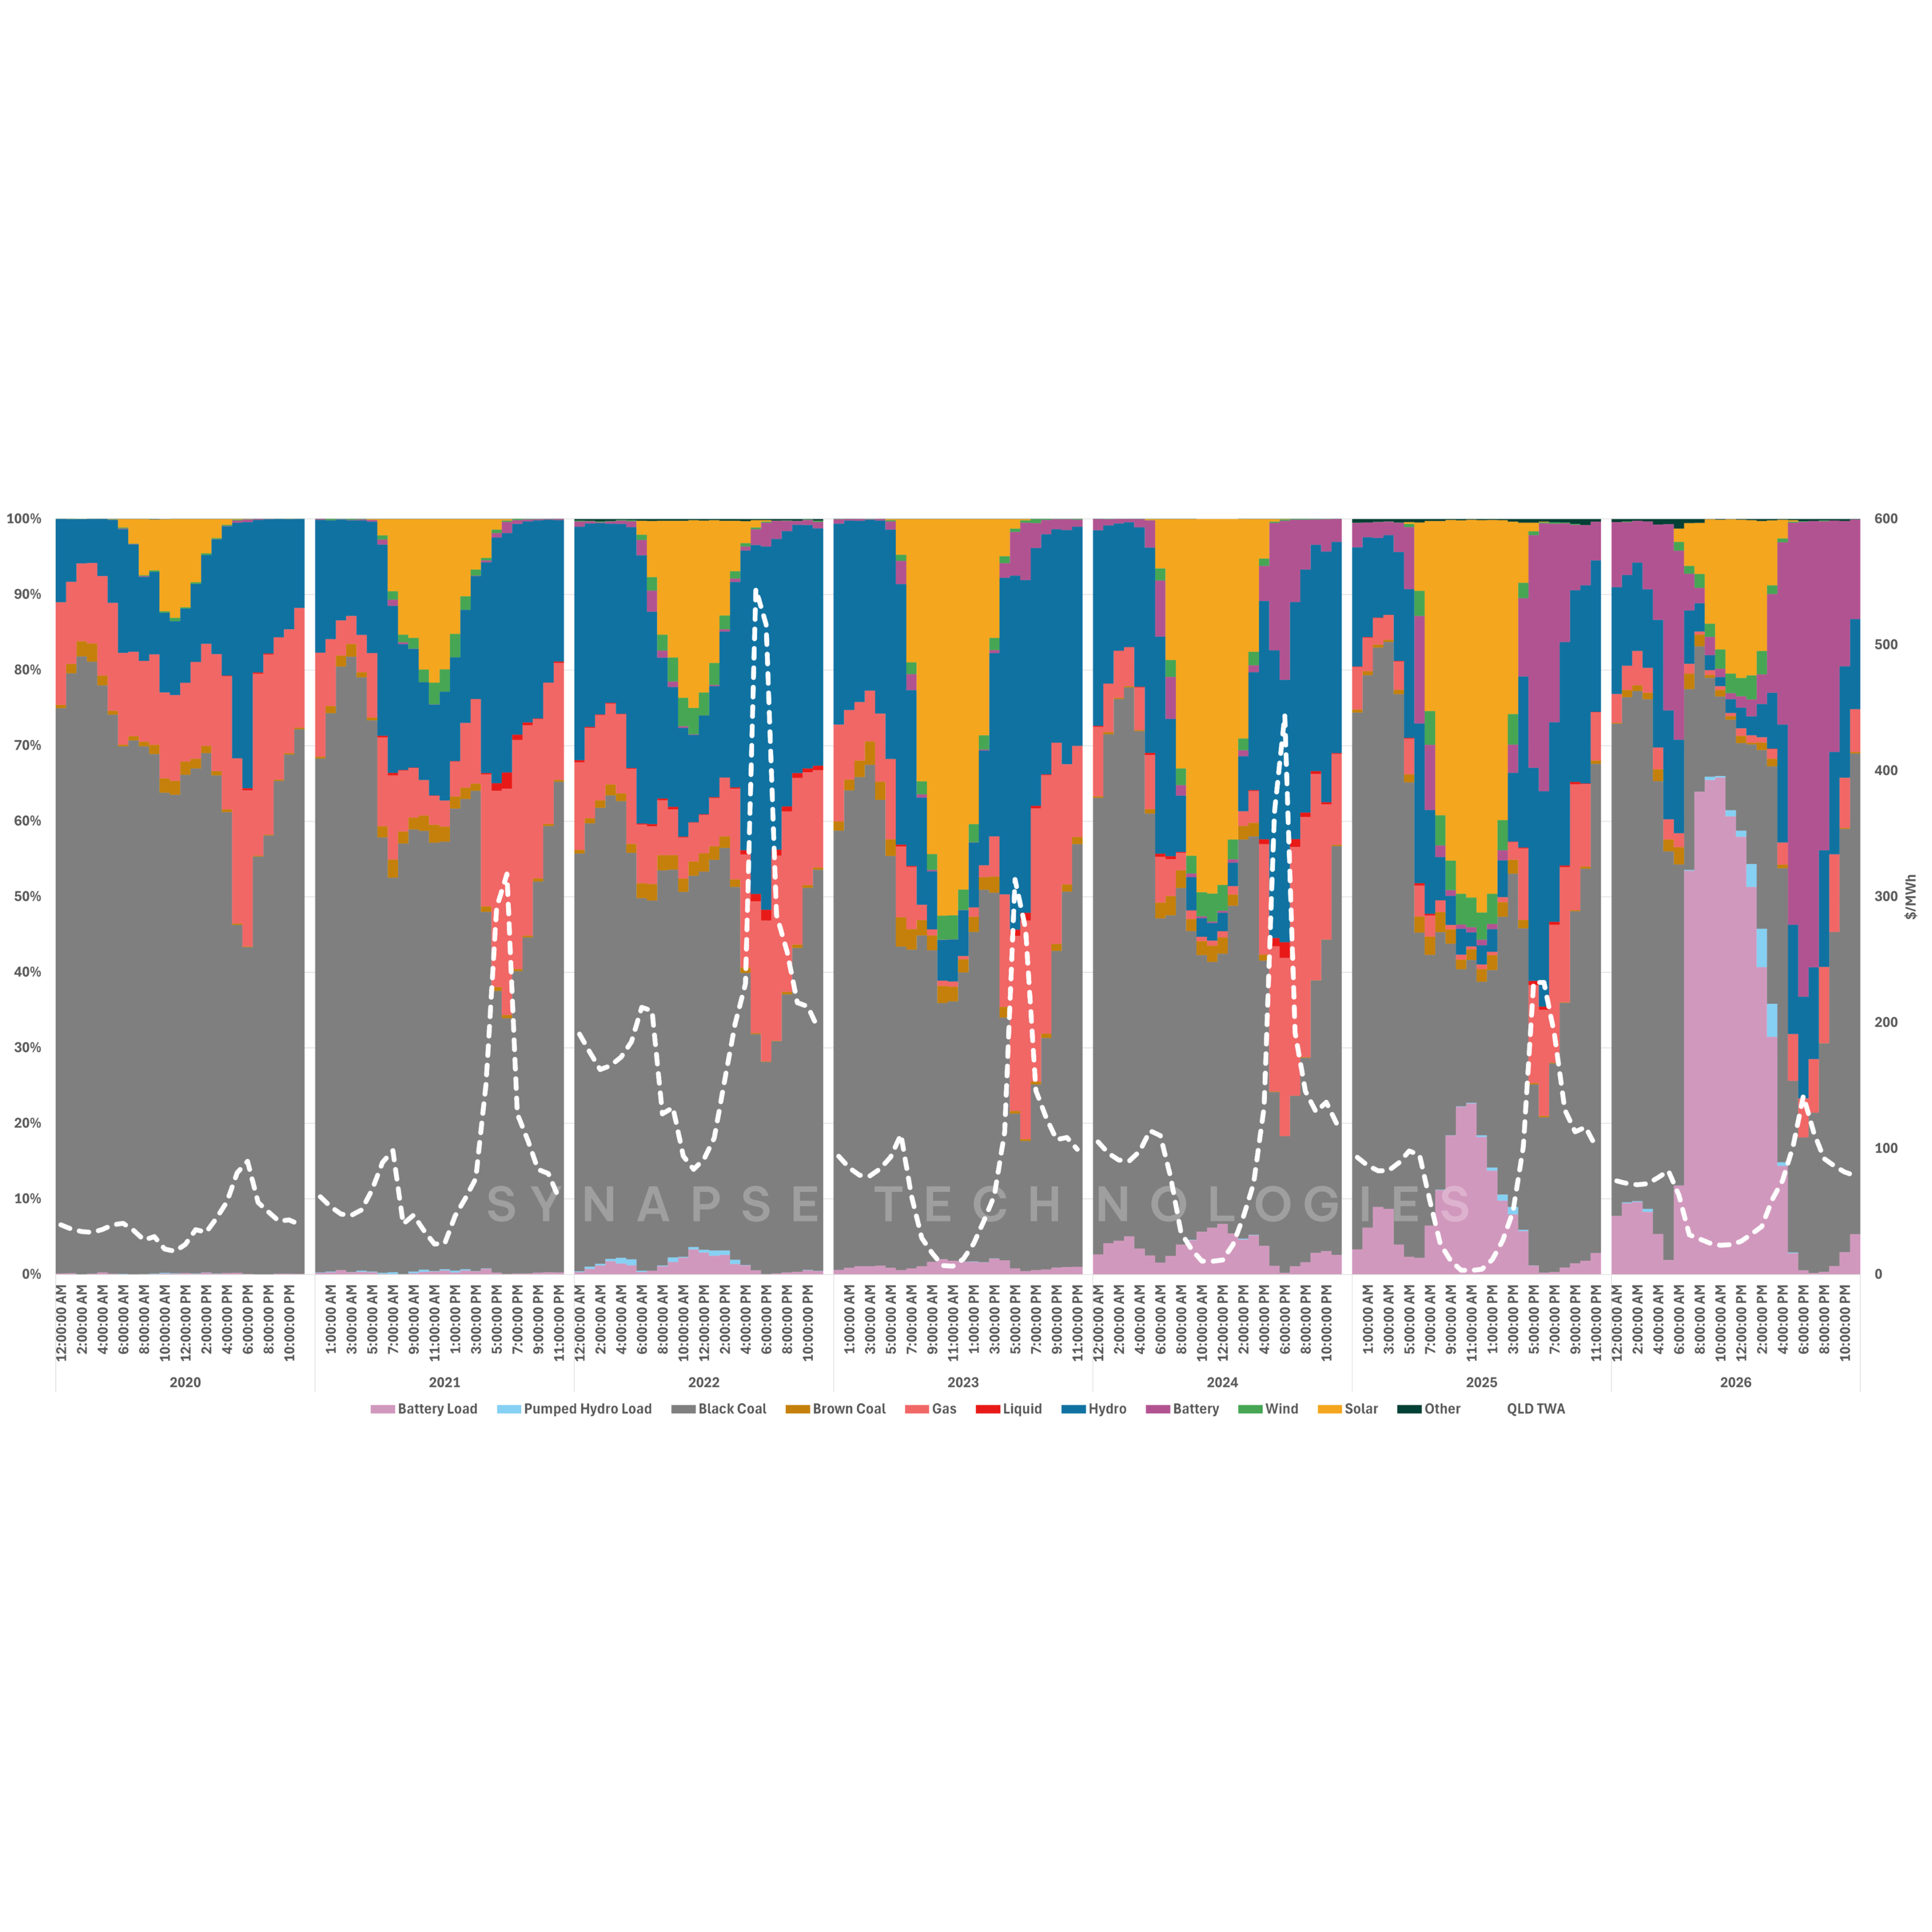
This withdrawal does not smooth the demand curve but sharpens it. As the sun sets and rooftop output declines, demand returns, often within a compressed window (5PM – 8PM). Evening peaks have only increased by ~0.12 GW (SA) to 0.6 GW (QLD) but, importantly, the ramp has grown by up to 2 GW, particularly in NSW and Queensland where the scale of both demand and rooftop penetration is largest. For context, this means that, on average, the ramp in Queensland is equivalent to turning on its largest coal generator (1.6 GW) from zero generation to full production during a 5 to 6 hour period, only to be turned down again as the sun rises.
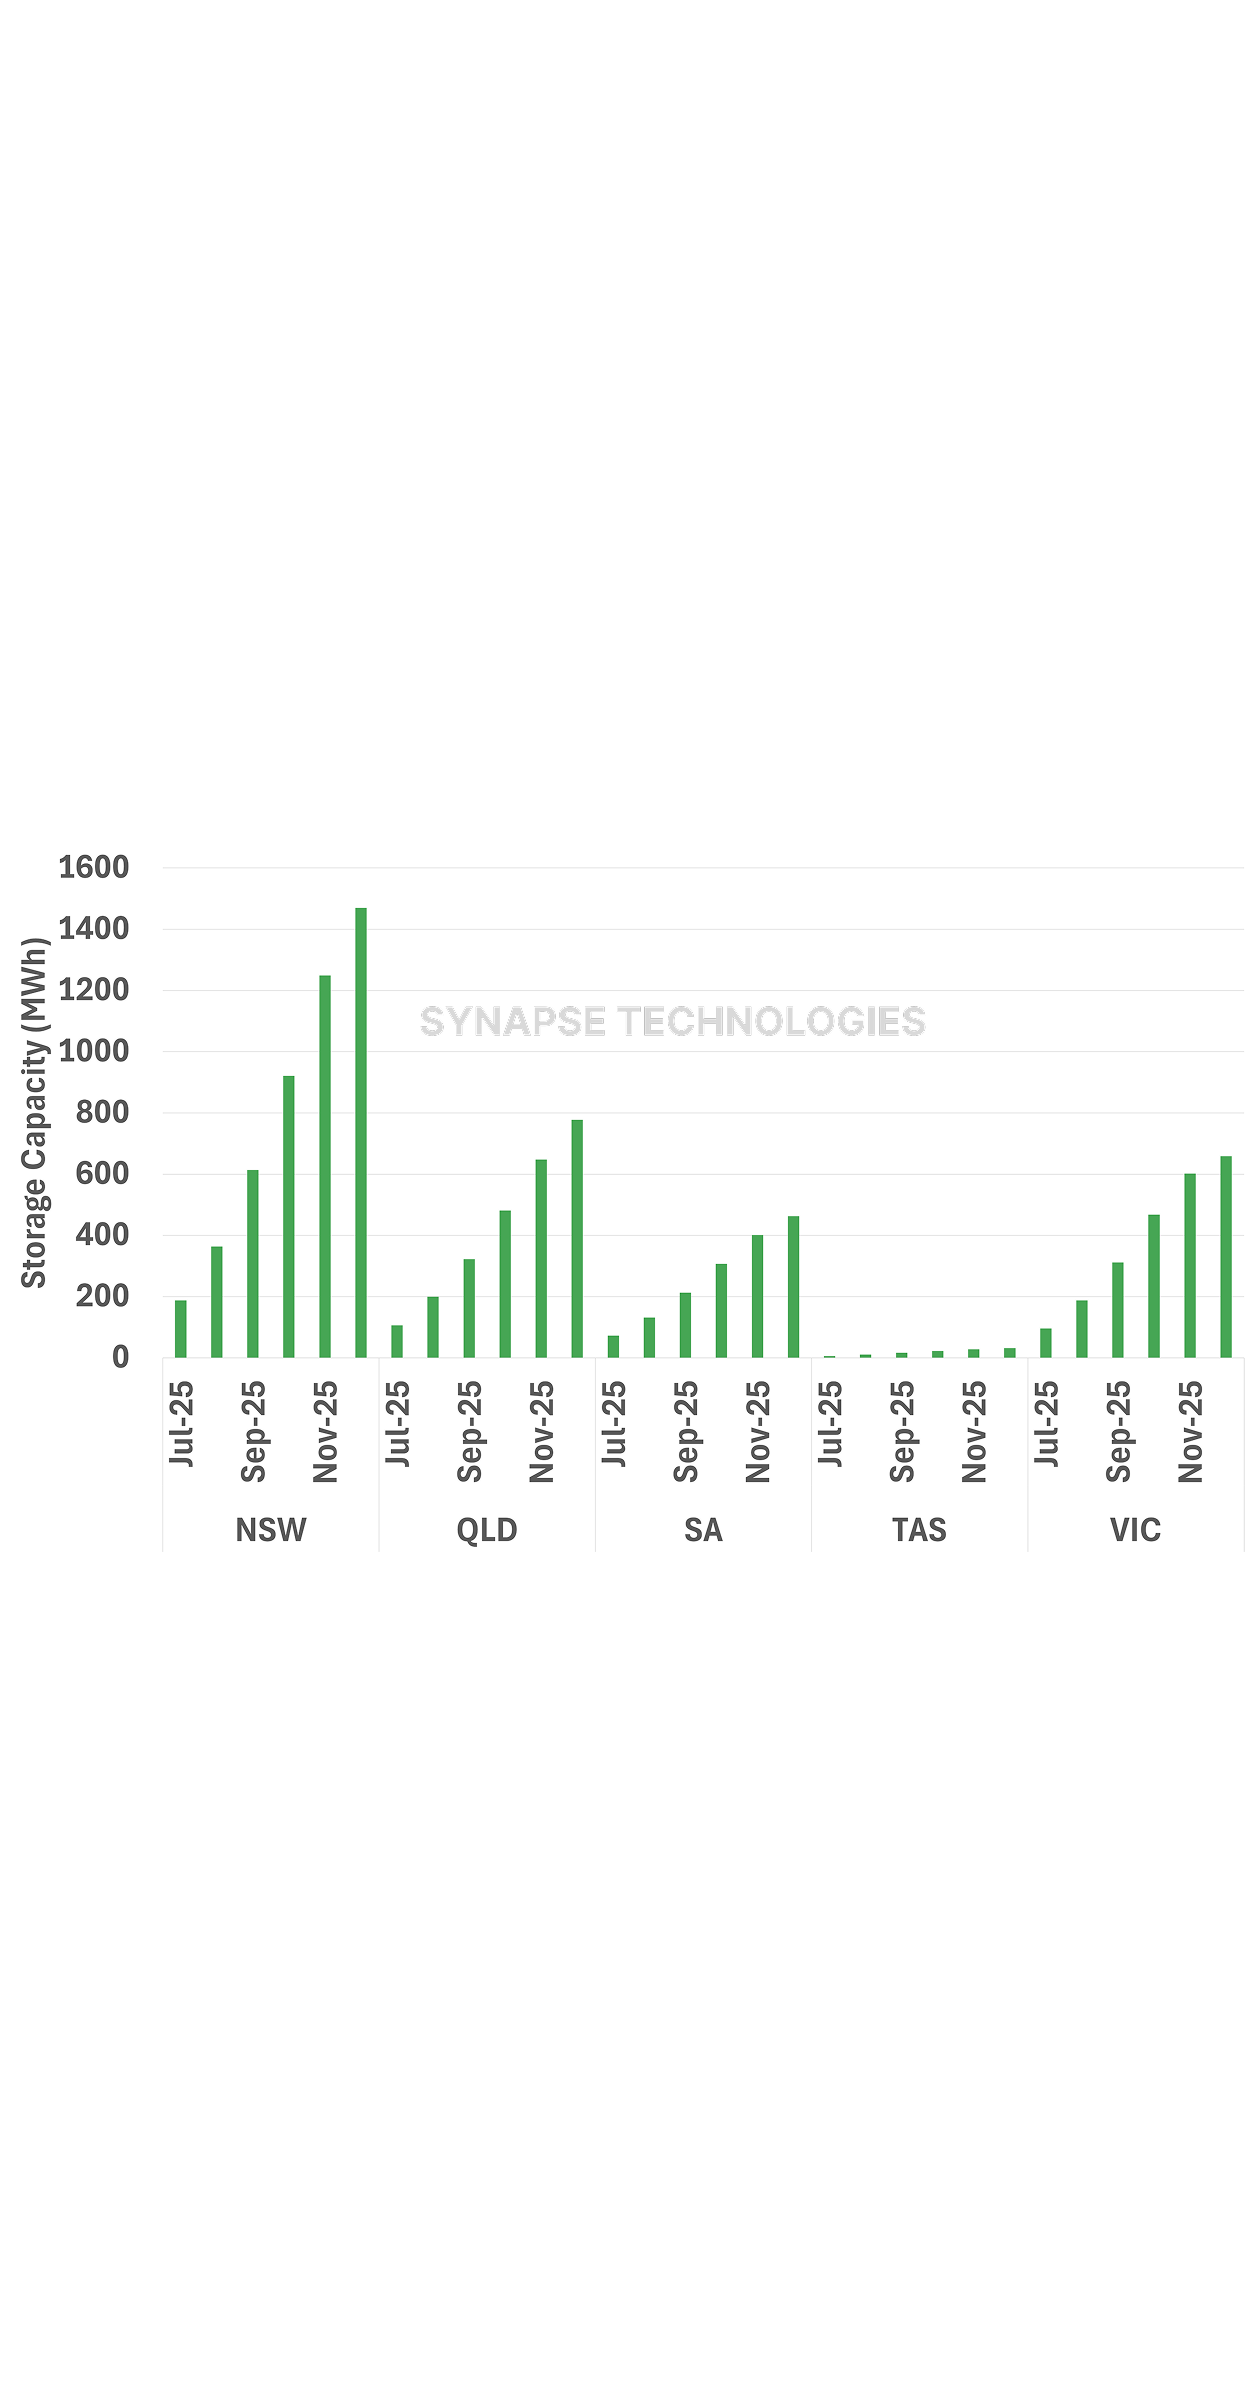
To offset this ramping rollercoaster and add flexibility, the Australian Government introduced the popular Cheaper Home Batteries Program in 2025. The home battery subsidy enables households to store excess solar and meet part – or all – of their own evening demand. Covered in Watt’s the Story Vol. 1, this policy is already reshaping grid dynamics. It may even shift the NEM into a different operating regime in which the system no longer just manages peak demand, but balances midday surplus and progressively self-supplied peaks, pushing flexibility onto the demand-side.
This creates space.
Demand for demand
There is now growing capacity in the system for new, sizable loads – particularly those that can align with periods of excess renewable generation or operate flexibly. In this context, parts of the NEM – especially South Australia – are increasingly well suited to support new demand-side investments. Not because demand is needed everywhere, but because at the right times, the system is starting to quietly need it.
For a long time, the current demand profile and behaviour was viewed as a South Australian phenomenon – a function of its smaller system size and high rooftop uptake. But this is no longer the case. NSW, Victoria and Queensland are increasingly exhibiting the same characteristics of suppressed midday demand, sharper evening rebounds, and greater intraday volatility.
South Australia, however, retains the clearest signal of where this trajectory leads.
Negative pricing
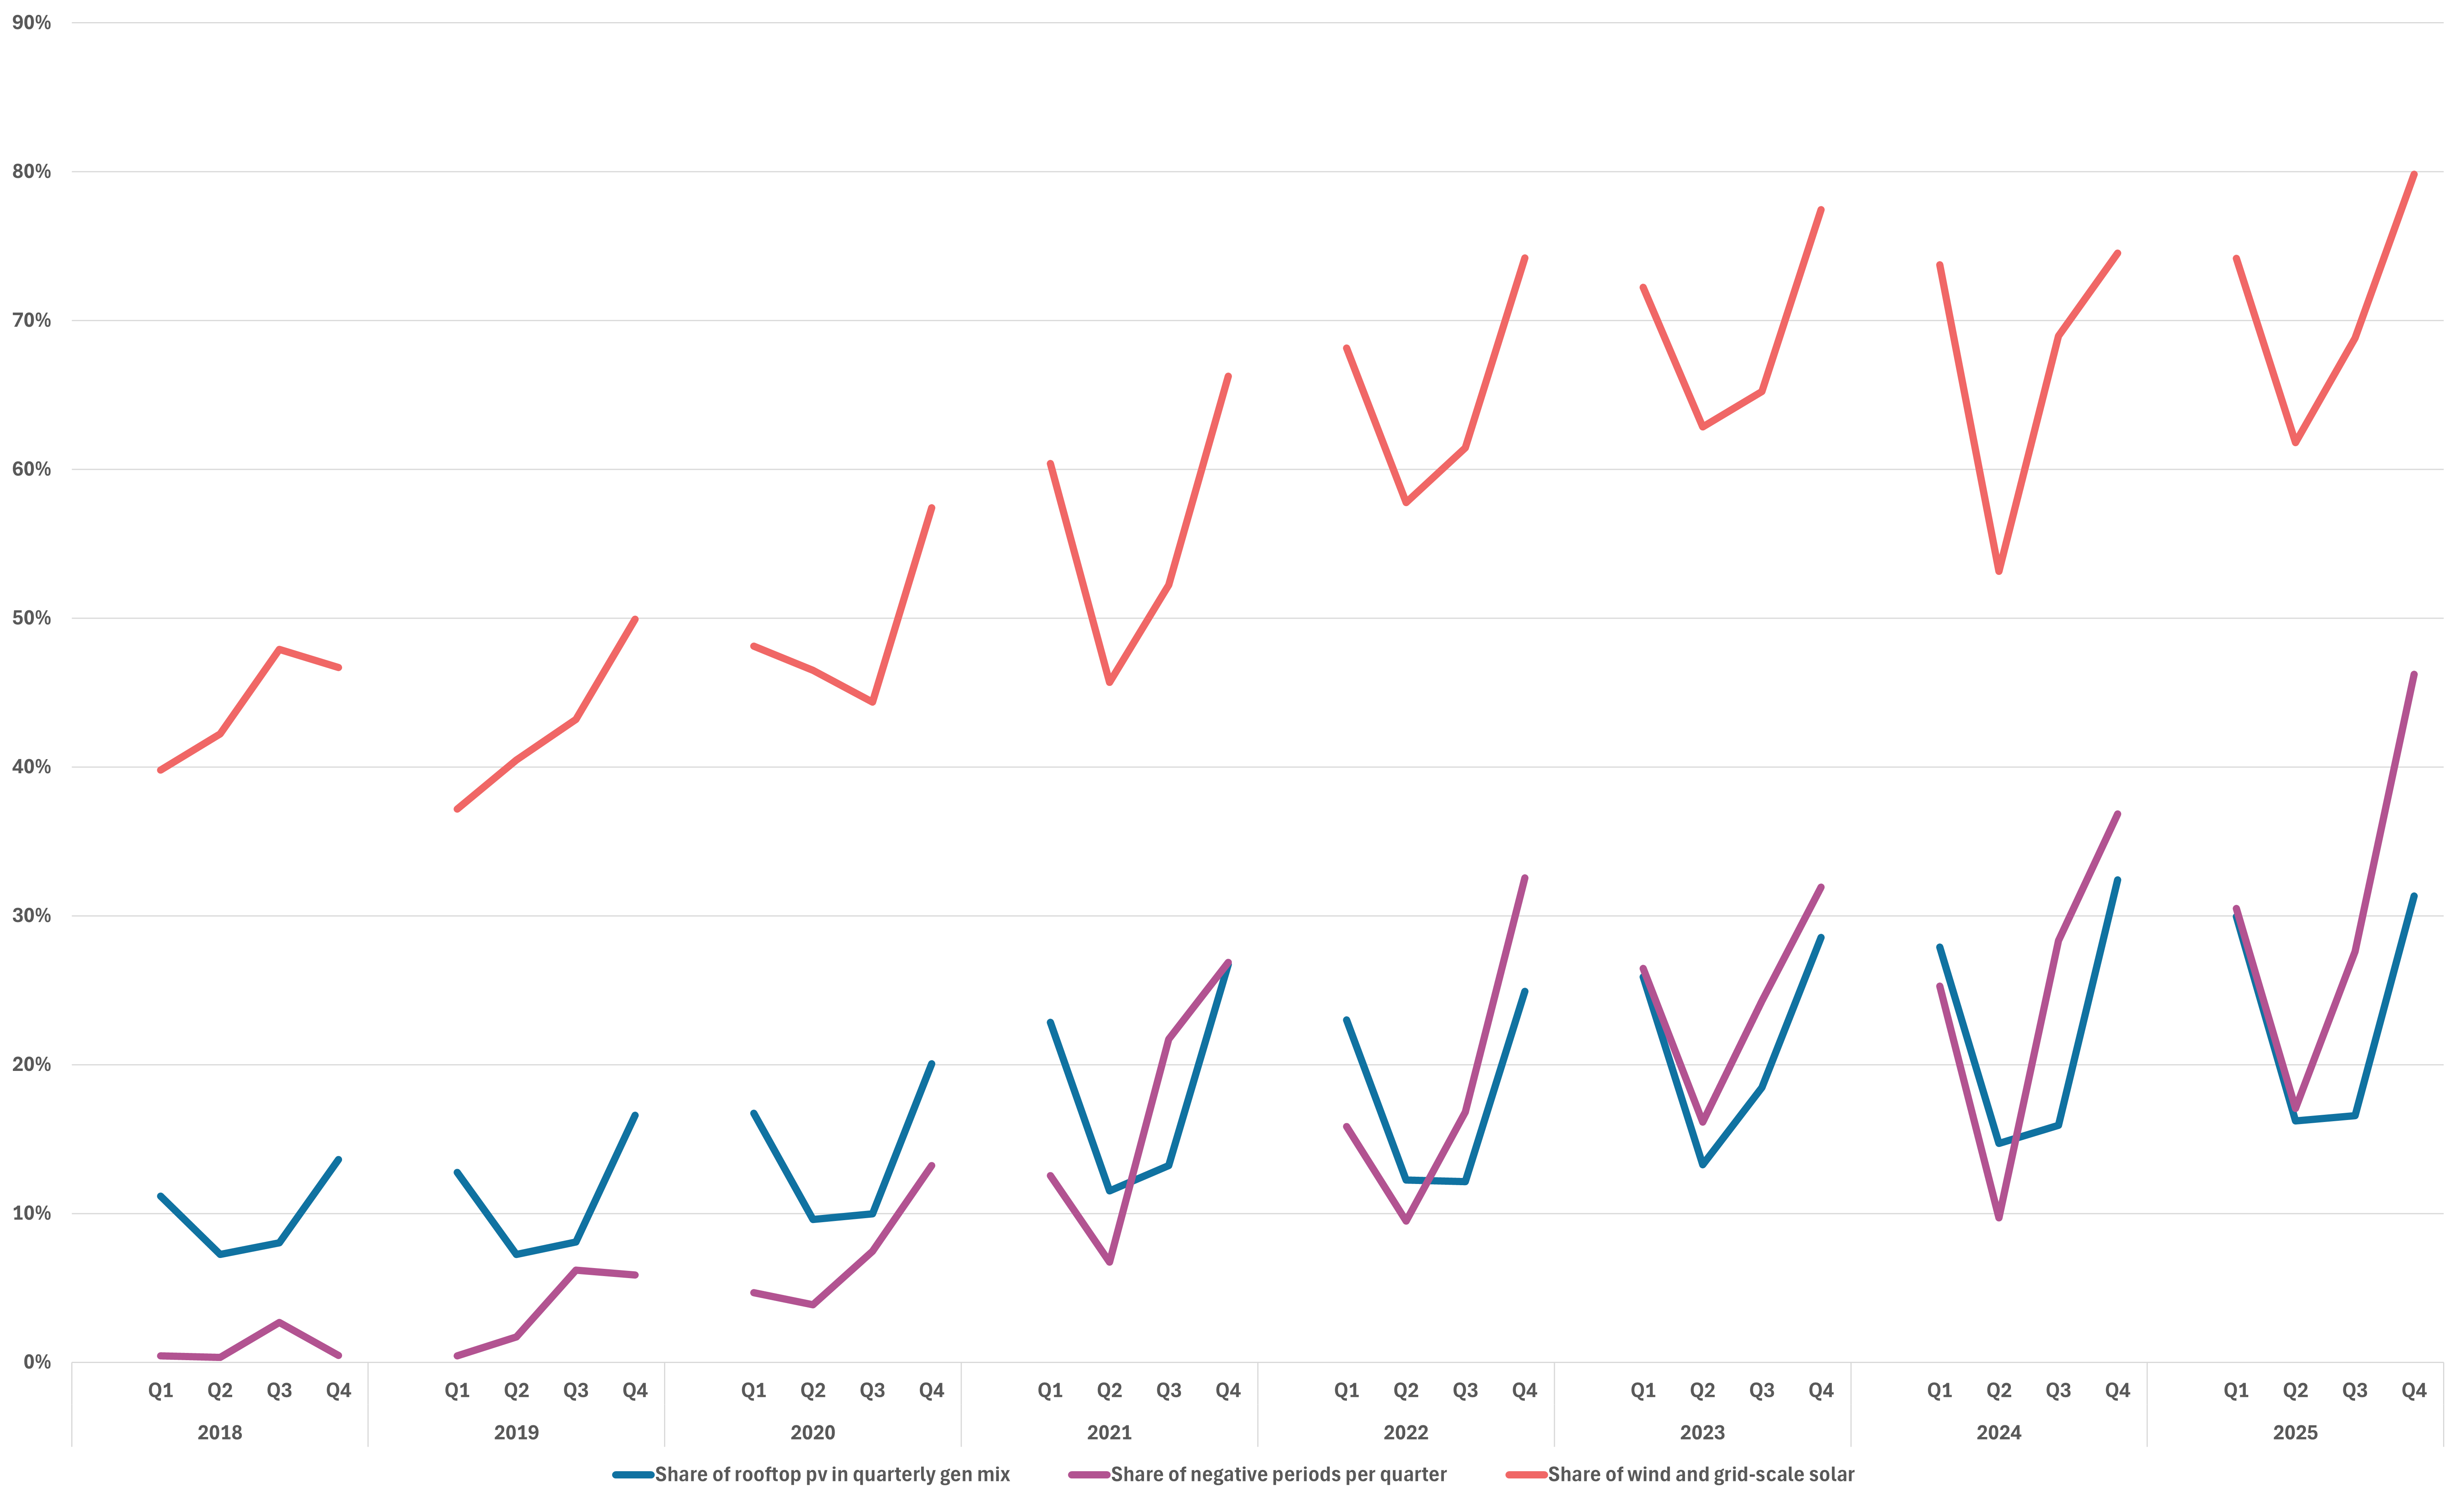
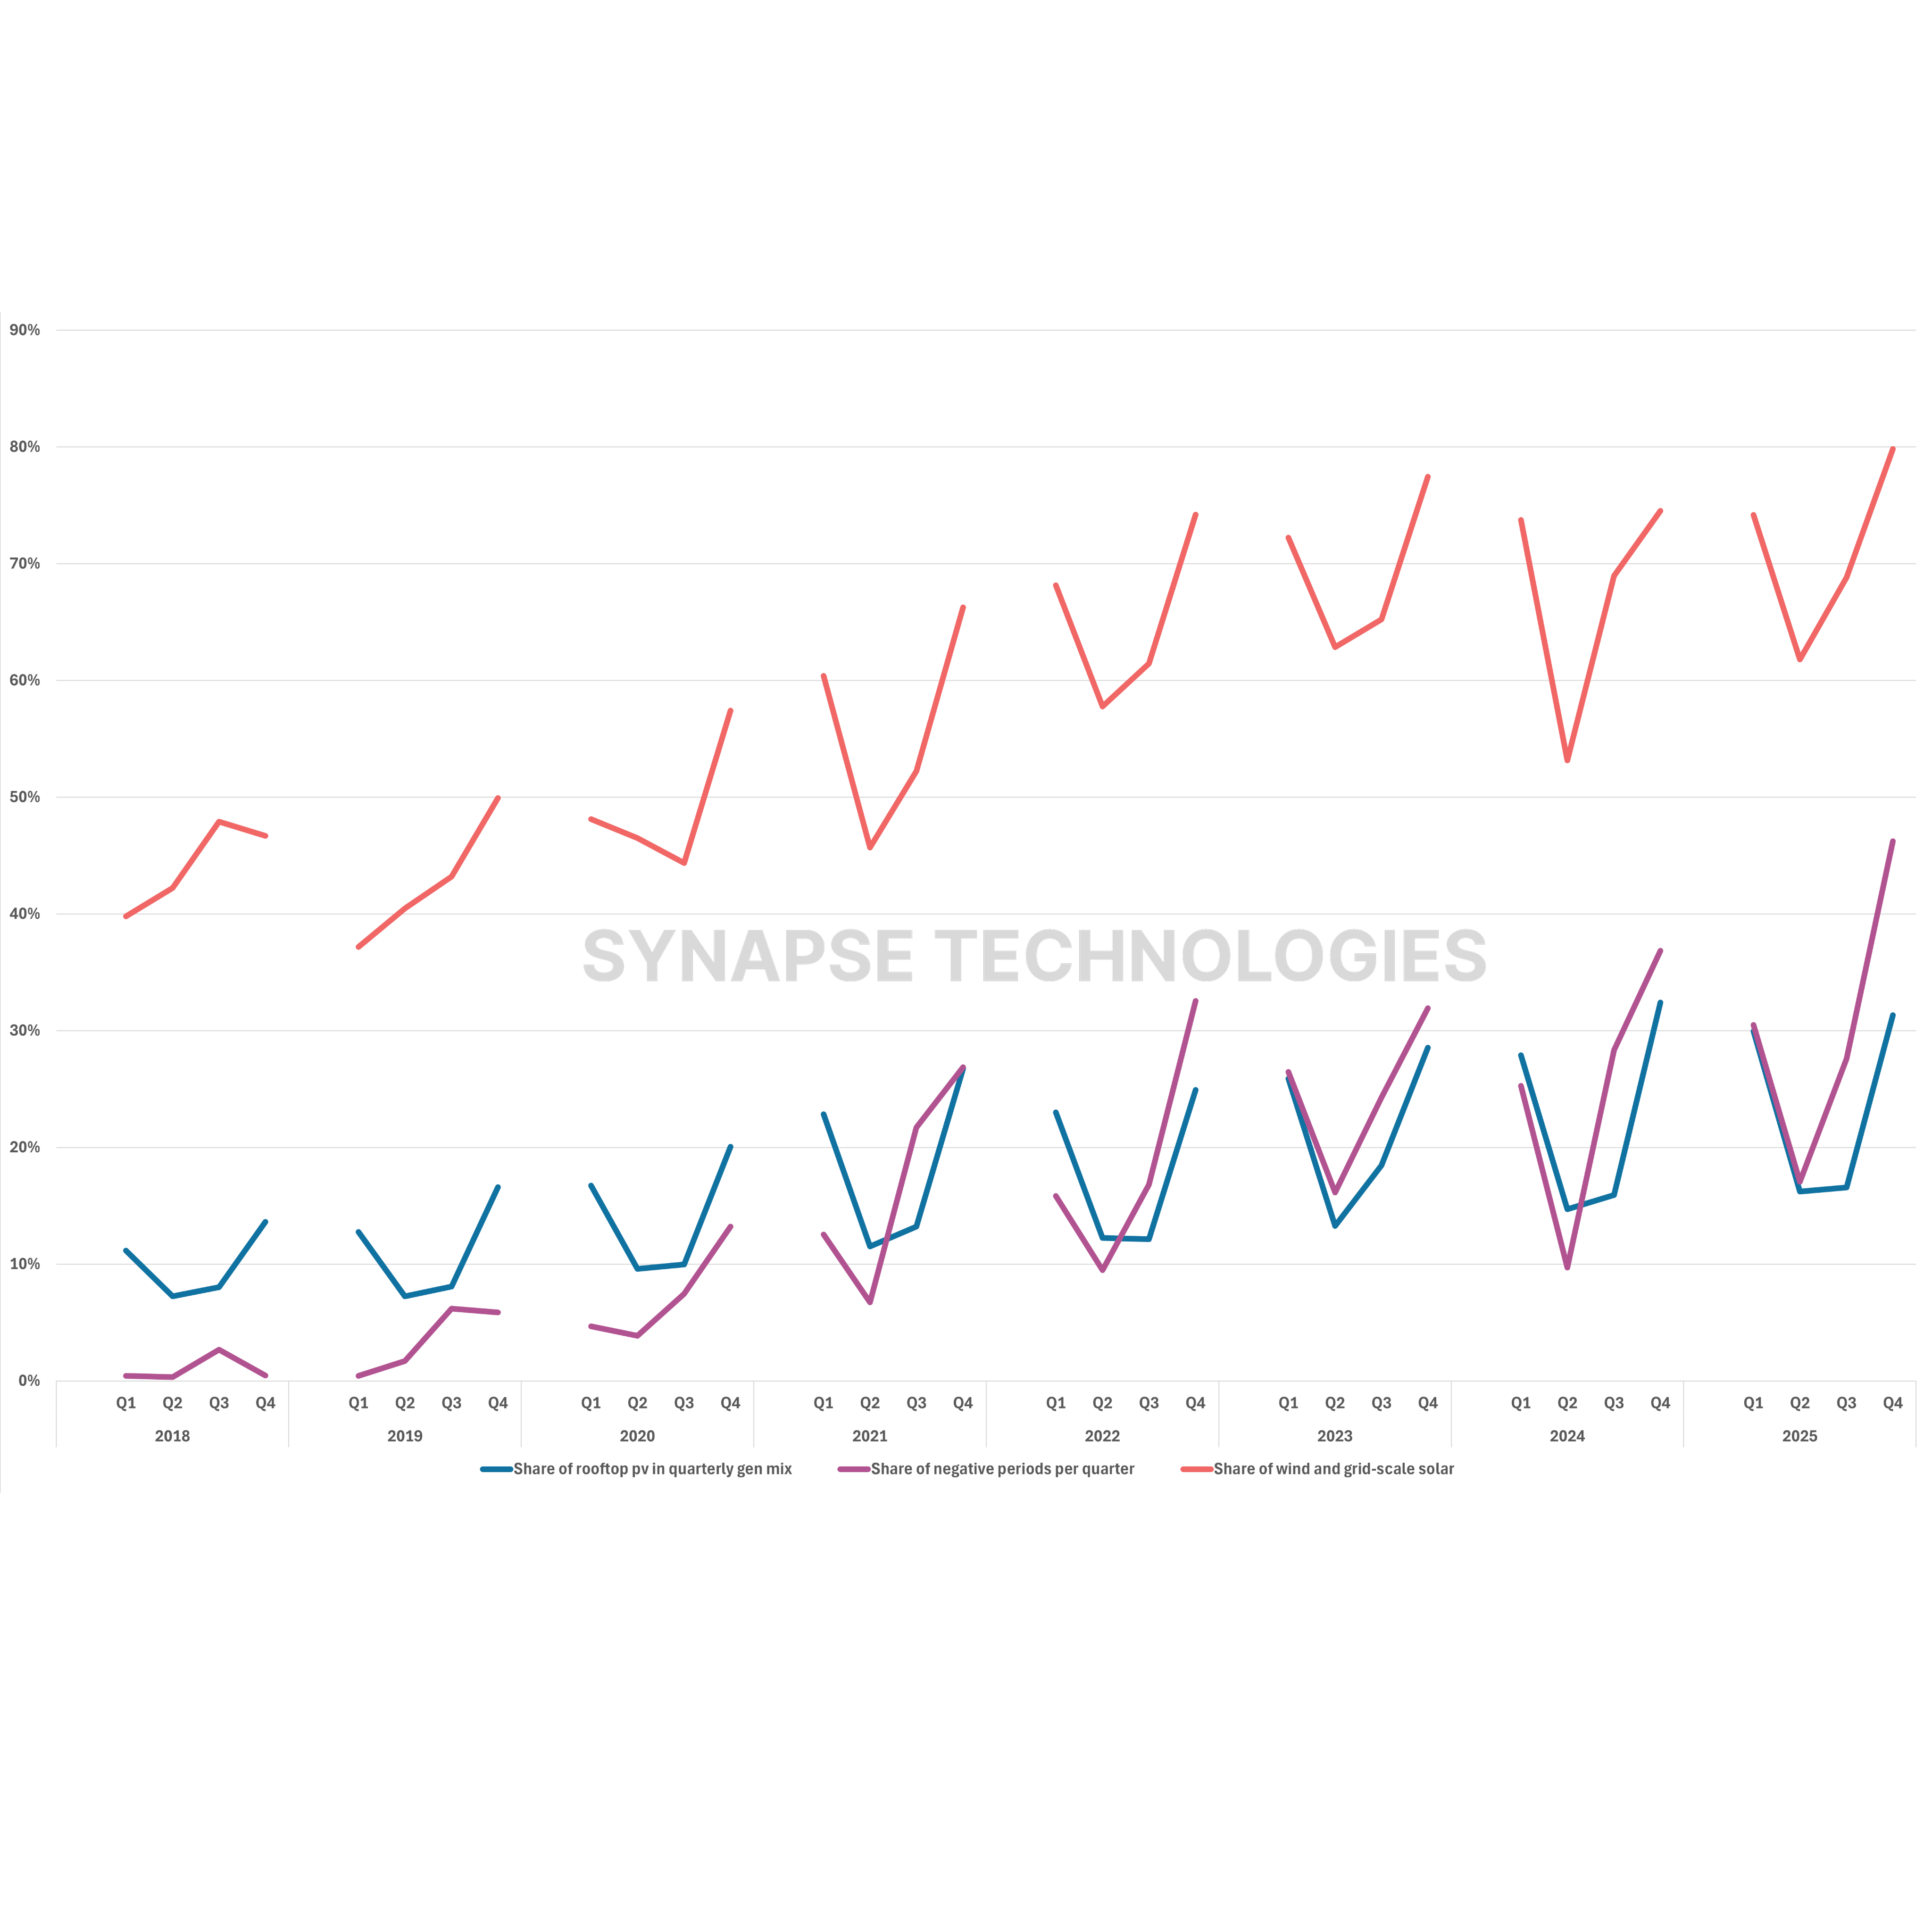
Rooftop solar alone contributes between 15% and 30% (and growing) of total quarterly generation in South Australia today, with spring and summer seasons (Q1 and Q4) unsurprisingly the highest. And as midday demand has decreased, the number of negative price intervals has increased – significantly. In fact, in Q4 2025, over-supply led to almost half (46%) of all dispatch intervals in the state returning negative prices, a NEM quarterly record.
While rooftop solar is a key contributor to these negative price trends, South Australia also has the highest grid-scale, predominantly wind, renewable penetration (energy mix %) of all NEM mainland states. So much so that the same Q4 saw grid-scale renewables meet 80% of operational demand in the state. In other words, in Q4 2025 NEM-connected loads (with spot price exposure) not only got paid to use electricity about half the time, but the electricity they used was overwhelmingly supplied by renewables.
Historically, the central grid challenge has been ensuring enough generation to meet peak demand. That challenge remains, but it is now accompanied by another: managing periods where there is too much generation relative to demand. This is not to imply demand itself is declining. Underlying consumption across the NEM has remained relatively stable, with some growth in regions driven by population increases and early electrification trends. What has changed is the visibility and timing of that demand to the NEM. Rooftop solar effectively removes a portion of load during daylight hours. With the rapid uptake of household batteries, it remains to be seen when – or if – that load reappears in the evenings. In short, there is a growing demand for demand itself.
This is especially so with South Australia just last week opening 11,000km2 in Whyalla West and Gawler Ranges East to new renewable proposals as it strives towards its target of sourcing 100% net electricity from renewable generation by 2027. This further opens the field for new loads – and it is encouraging to see South Australia’s transmission planner, Electranet, preparing for such a future. It is planning for peak demand in South Australia to double over the next 15 years, with CEO Simon Emms saying it has already seen significant growth in industries including data centres, magnetite mining (a feedstock for green steel) and copper mining in the region. “If electricity is a proxy for economic growth, increased electricity consumption means we’ve got a really exciting future ahead for the state,” Emms said. Certainly, the state is making itself attractive for demand-side investment.

.png)