

Winter is coming: why the Iran war impacts Australia's NEM
Uncertainty has again descended over global energy markets. Not only have oil routes been disrupted by the US Israel Iran war, so too have some of world’s most important natural gas supply chains. This is consequential for Australia as a major liquified natural gas (LNG) exporter, and because gas plays a pivotal role in our own domestic energy system, especially in winter. If it continues, this distant war may ripple into the Australian grid.
The most immediate shock has come from Qatar, where production at the giant Ras Laffan LNG complex was forced to halt following attacks on key facilities. Ras Laffan is the world’s largest LNG facility and accounts for roughly 20% of global LNG supply, so its disruption is highly significant.
Typically, around 70% - 80% of Qatar’s LNG exports flow to Asian markets, including major importers such as China, Japan, India and South Korea. With a substantial portion of this supply now offline, buyers across Asia are scrambling to secure replacement cargoes, constricting the LNG market and placing upward pressure on prices.
This disruption puts Australia in a critical position. Australia is one of the world’s largest LNG exporters and a major supplier to Asia, accounting for roughly 20% of LNG imports across key Asian markets. With Qatari supply disrupted, Australian cargoes become one of the closest and most reliable alternatives for Asian buyers.
But Australia’s role as a global LNG exporter also ties our domestic energy markets to international gas prices. When Asian LNG prices rise, the incentive to export Australian gas increases, which in turn can push domestic gas prices higher. This dynamic is particularly important in Australia’s east, where gas-fired generators directly supply electricity into Australia’s main power market, the National Electricity Market (NEM).
In this 3rd edition of Watt’s the Story, we take a deeper look at the linkages between Australia’s eastern gas markets, the National Electricity Market (NEM), and the Asian LNG market. While these systems operate somewhat independently during stable market conditions, global disruptions like the current conflict tighten connections and cause international volatility to be felt domestically. Since the NEM operates on what’s known as ‘marginal pricing,’ the last and most expensive generator needed to meet demand sets the price for the entire region, so even small volumes of gas generation can determine electricity prices – something that becomes especially evident during winter peaks.
The bridge between global LNG markets and the NEM largely runs through Queensland. The state hosts the three LNG export terminals at Gladstone, connecting east-coast gas production directly to international buyers. When Asian LNG prices rise, the opportunity cost of supplying gas domestically rises along with it, pushing local prices closer to export price parity.
%20gas%20demand%20(estimate)%20.png)
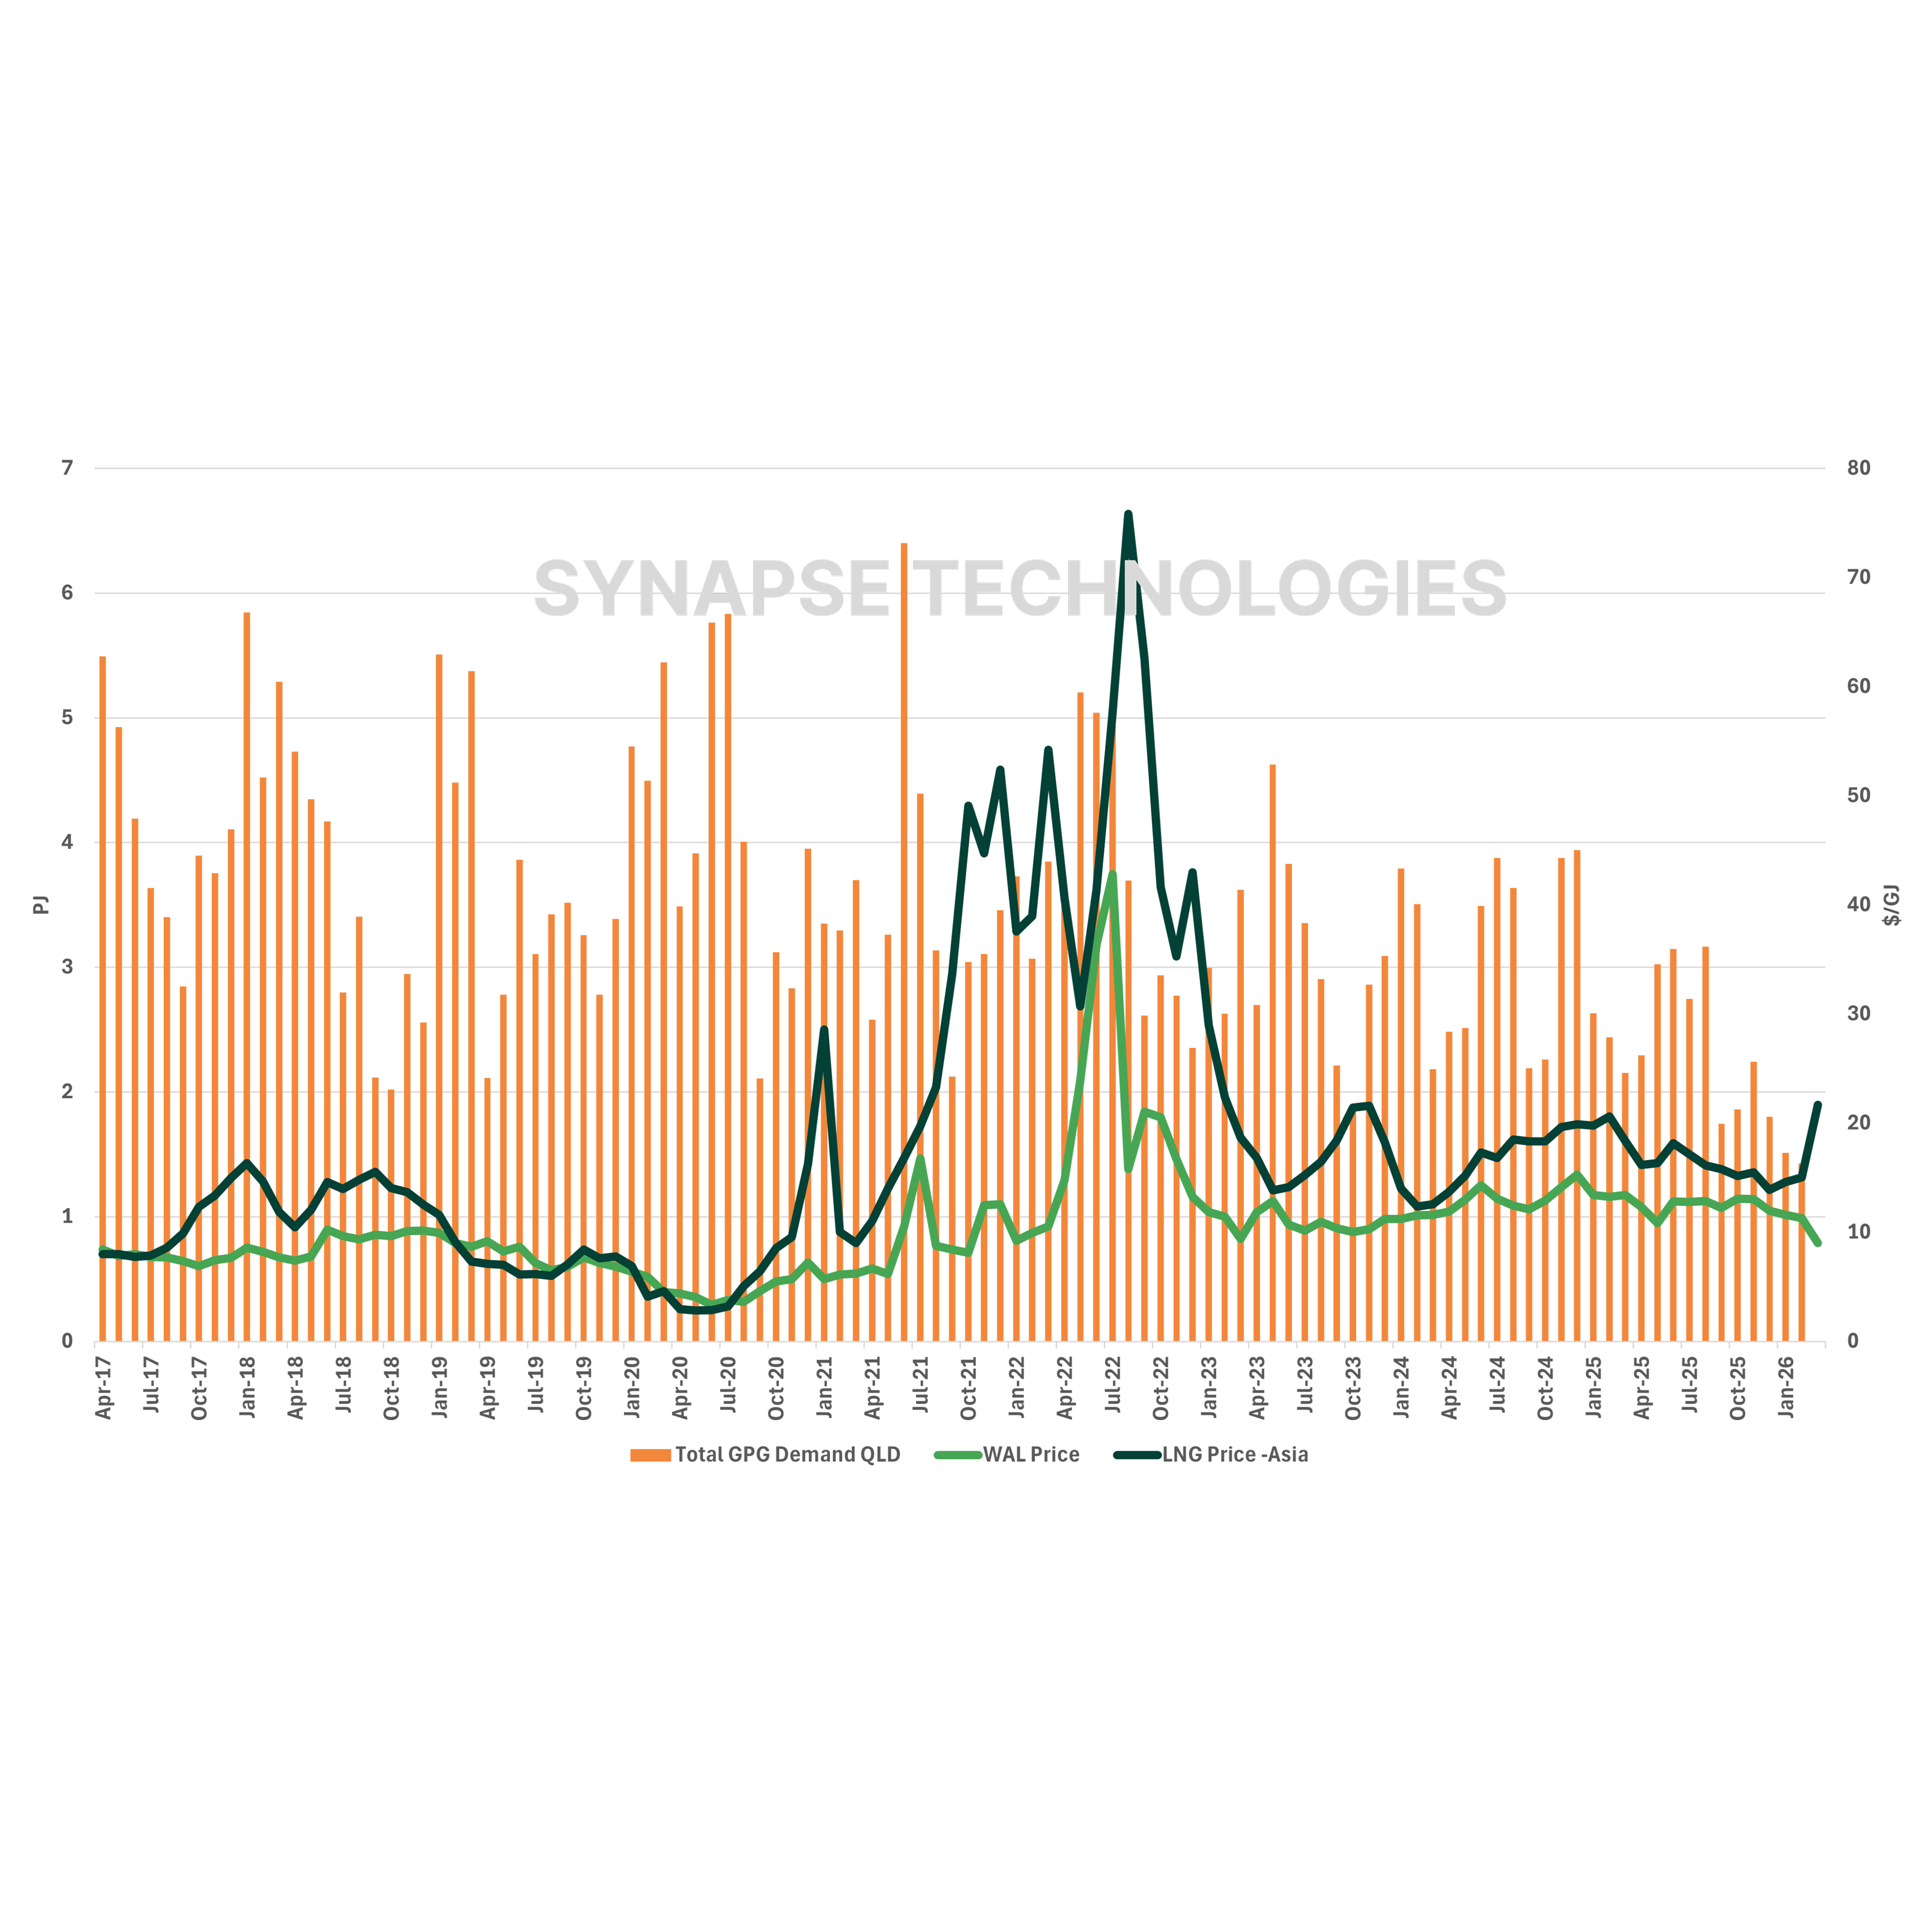
Figure 1 illustrates this relationship by plotting monthly gas consumption at gas-fired generators in Queensland between 2017 and 2026 alongside gas price averages in Asian markets and from Queensland’s key gas supply hub, Wallumbilla. Over this period, Queensland gas generators have consumed, on average, around 3 - 4 petajoules (PJ) per month, with seasonal peaks over 6 PJ. Meanwhile, Wallumbilla spot prices have fluctuated between lows of $5/GJ (AUD) during periods of oversupply to highs of $40/GJ during periods of market stress, often moving in tandem with Asian LNG price trends.
This data doesn’t show any strong correlation between domestic gas use and spot market prices. In other words, gas-fired generators in Queensland don’t seem to use more gas when merchant gas prices are low. This may be, in part, because most gas on the east-coast is supplied under pre-arranged contract prices, dampening real-time price discovery dynamics. More importantly, gas generators at large play a niche role as a nimble, dispatchable generation source in the NEM. This means their dispatch is primarily driven by broader system conditions (such as availability of lower-cost generators in the merit order). Additionally, since their costs can be passed on to consumers via generator bids into the NEM, they are even less sensitive to merchant gas prices.
What Figure 1 does clearly highlight is the importance of seasonality. When the weather gets colder, electricity demand rises (as does gas demand for heating), while renewable output, particularly solar, tends to be lower. Gas demand for gas powered generation (GPG) tends to peak in winter, when it can be more than double the shoulder seasons, despite higher fuel prices.
This seasonal dynamic is an important part of understanding how global gas shocks translate into the Australian NEM. A useful example is the global energy crisis that followed the start of Russia Ukraine war in February 2022. While international gas prices surged almost immediately (Figure 1), the most visible impact on Australia’s gas and electricity markets occurred the following winter. As temperatures dropped, gas-fired generators dispatched more frequently. During the winter of 2022, Queensland’s monthly gas consumption for power generation averaged 5 PJ (May – August), compared with recent summer levels closer to 2 – 3 PJ (Jan – March).
During that winter (which had quite a cold start), energy prices in Queensland rose sharply with average gas and power prices reaching highs of $42/GJ (July) and $400/MWh (June), respectively – the highest average monthly price in a decade for both markets. Evening power peak prices that June also averaged a staggering $976/MWh. Admittedly, outages to coal units at Callide and Gladstone power stations also contributed to the price hikes over that period.
Interestingly, this new war erupted at the same time of year (February/March) as the Russia Ukraine war. The Wallumbilla gas price has not shown any bullishness despite the Asian LNG price already rising; an eerily similar reaction to February 2022 – a sign of things to come this winter?
If the current conflict persists and LNG supply disruptions continue,global gas prices could remain elevated for an extended period. With a majorsupplier like Qatar offline and Asian buyers competing for replacement cargoes,Australia’s LNG exporters will face strong incentives to supply internationalmarkets. Under these conditions, Australian gas prices could approach – perhapseven surpass – the winter 2022 levels, when east-coast gas prices averaged $35/GJ and wholesale electricity markets experienced significant volatility.

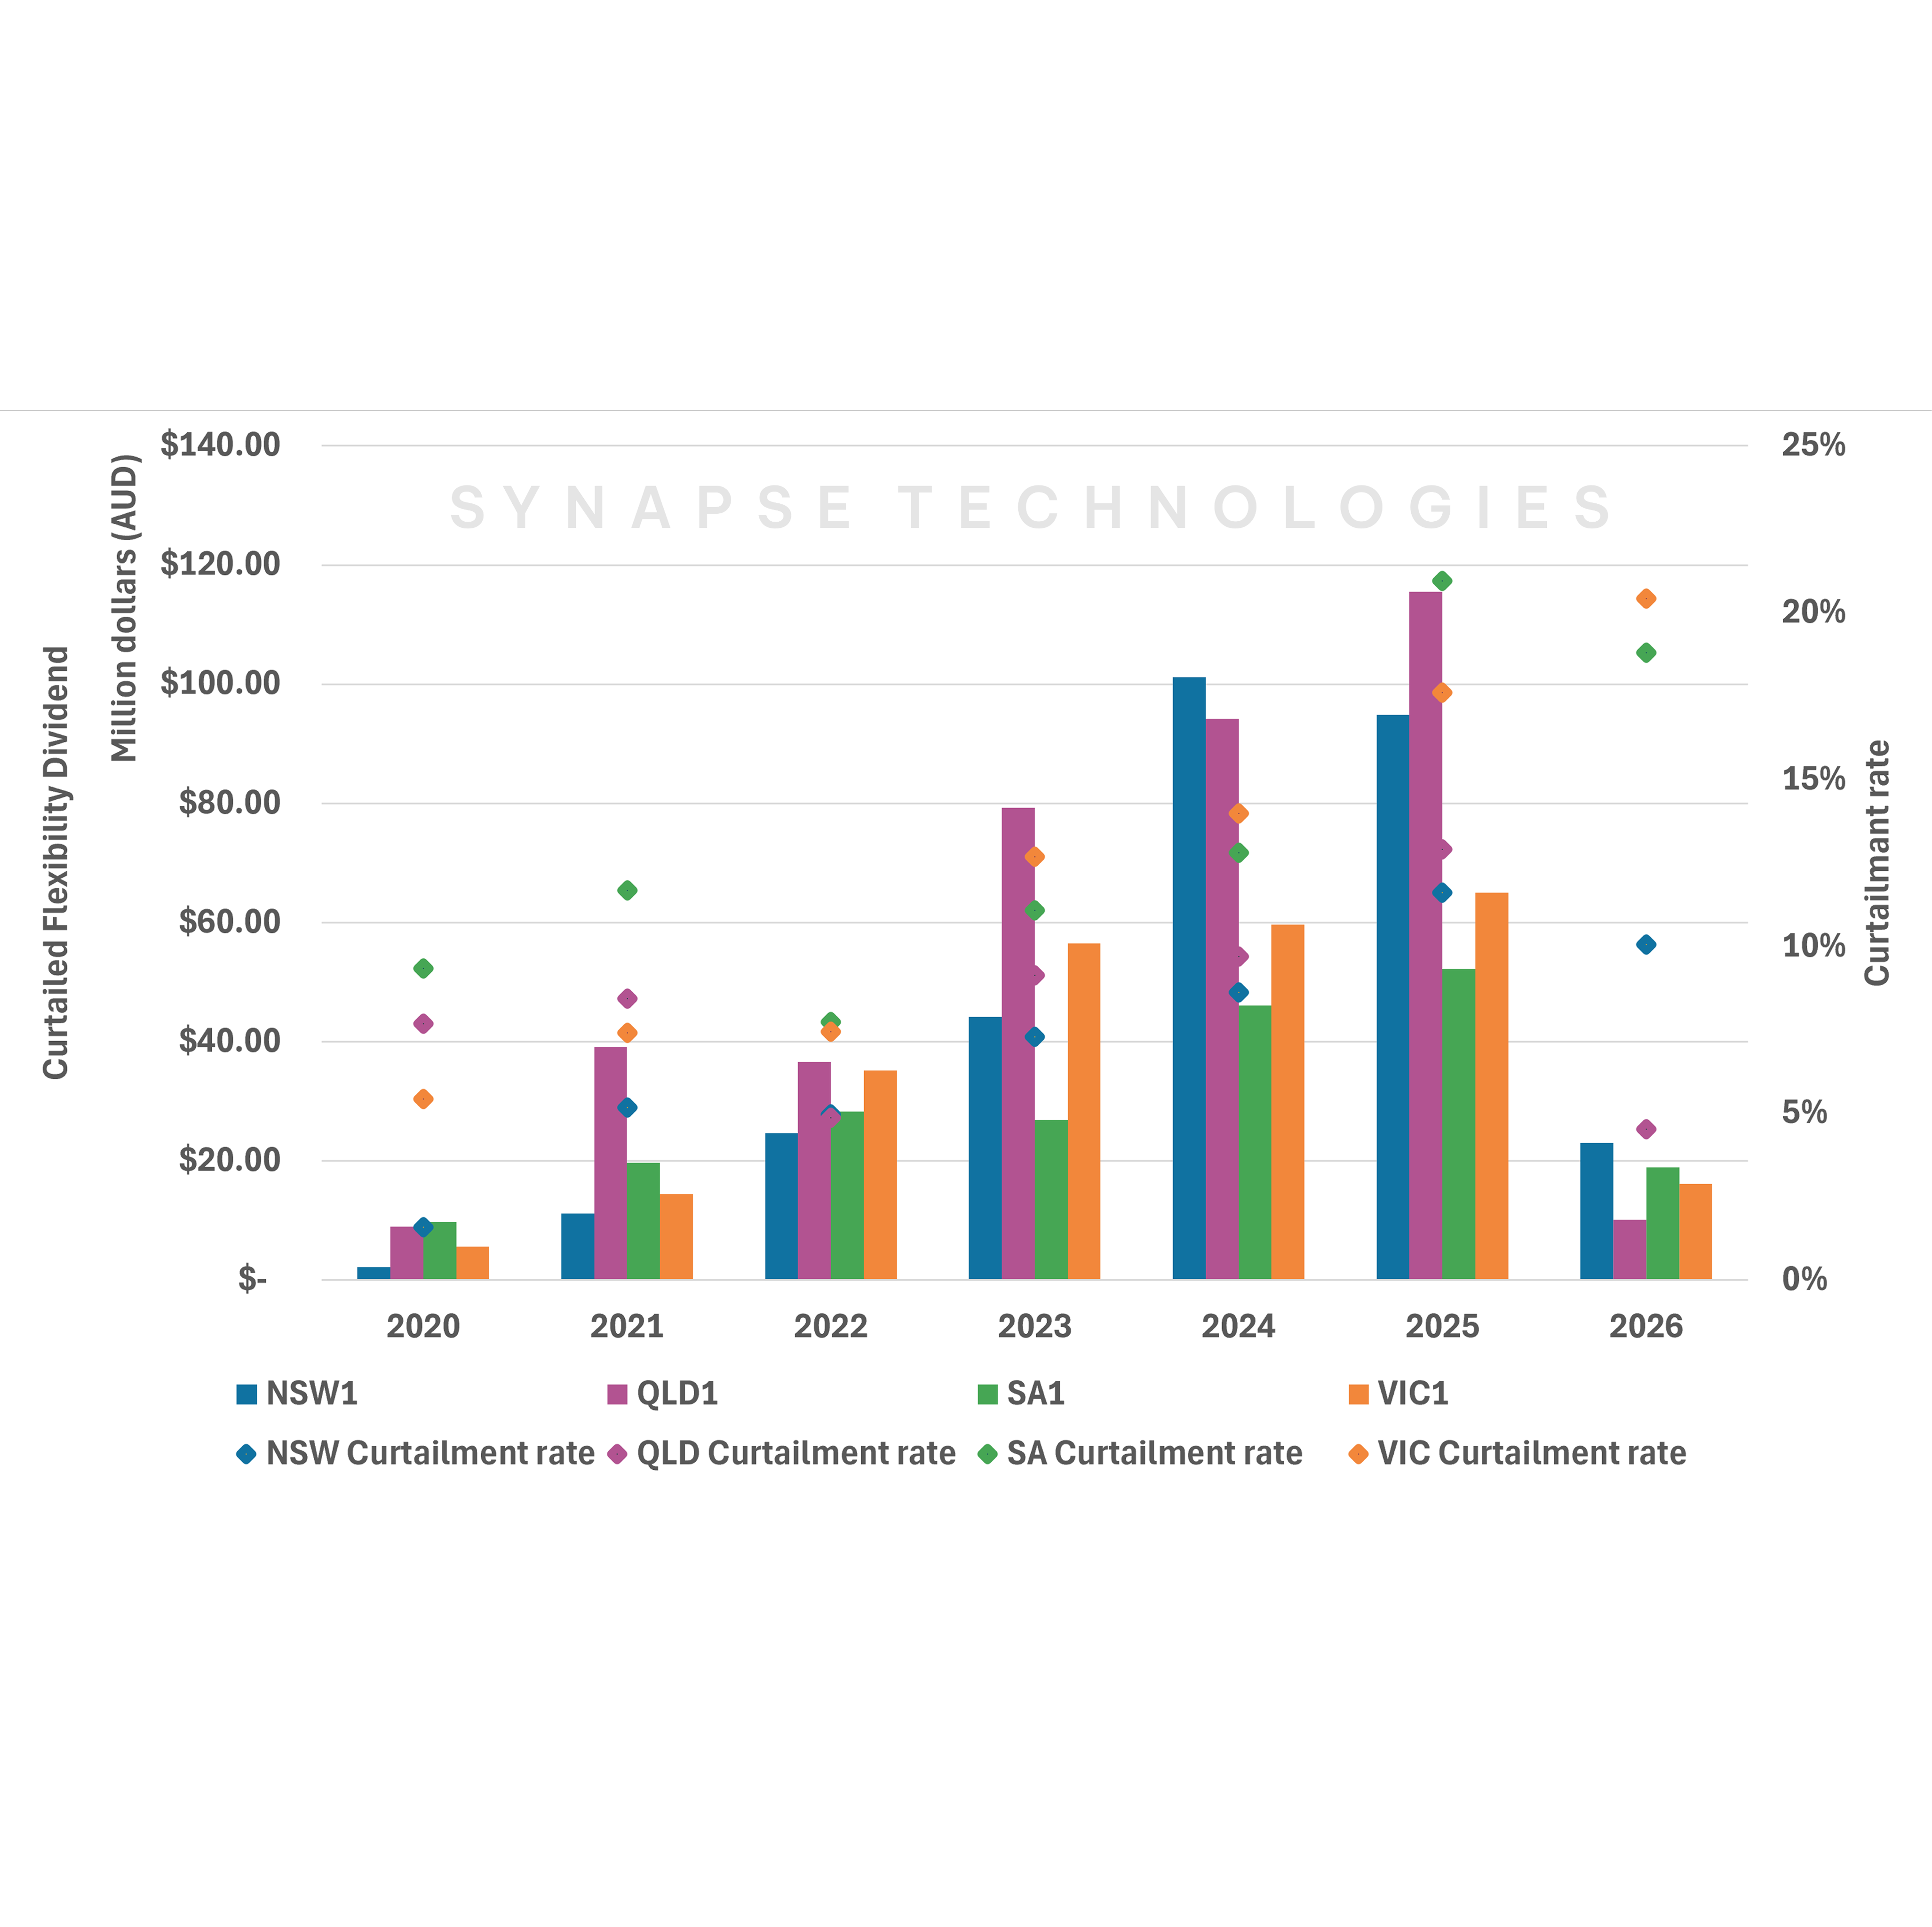
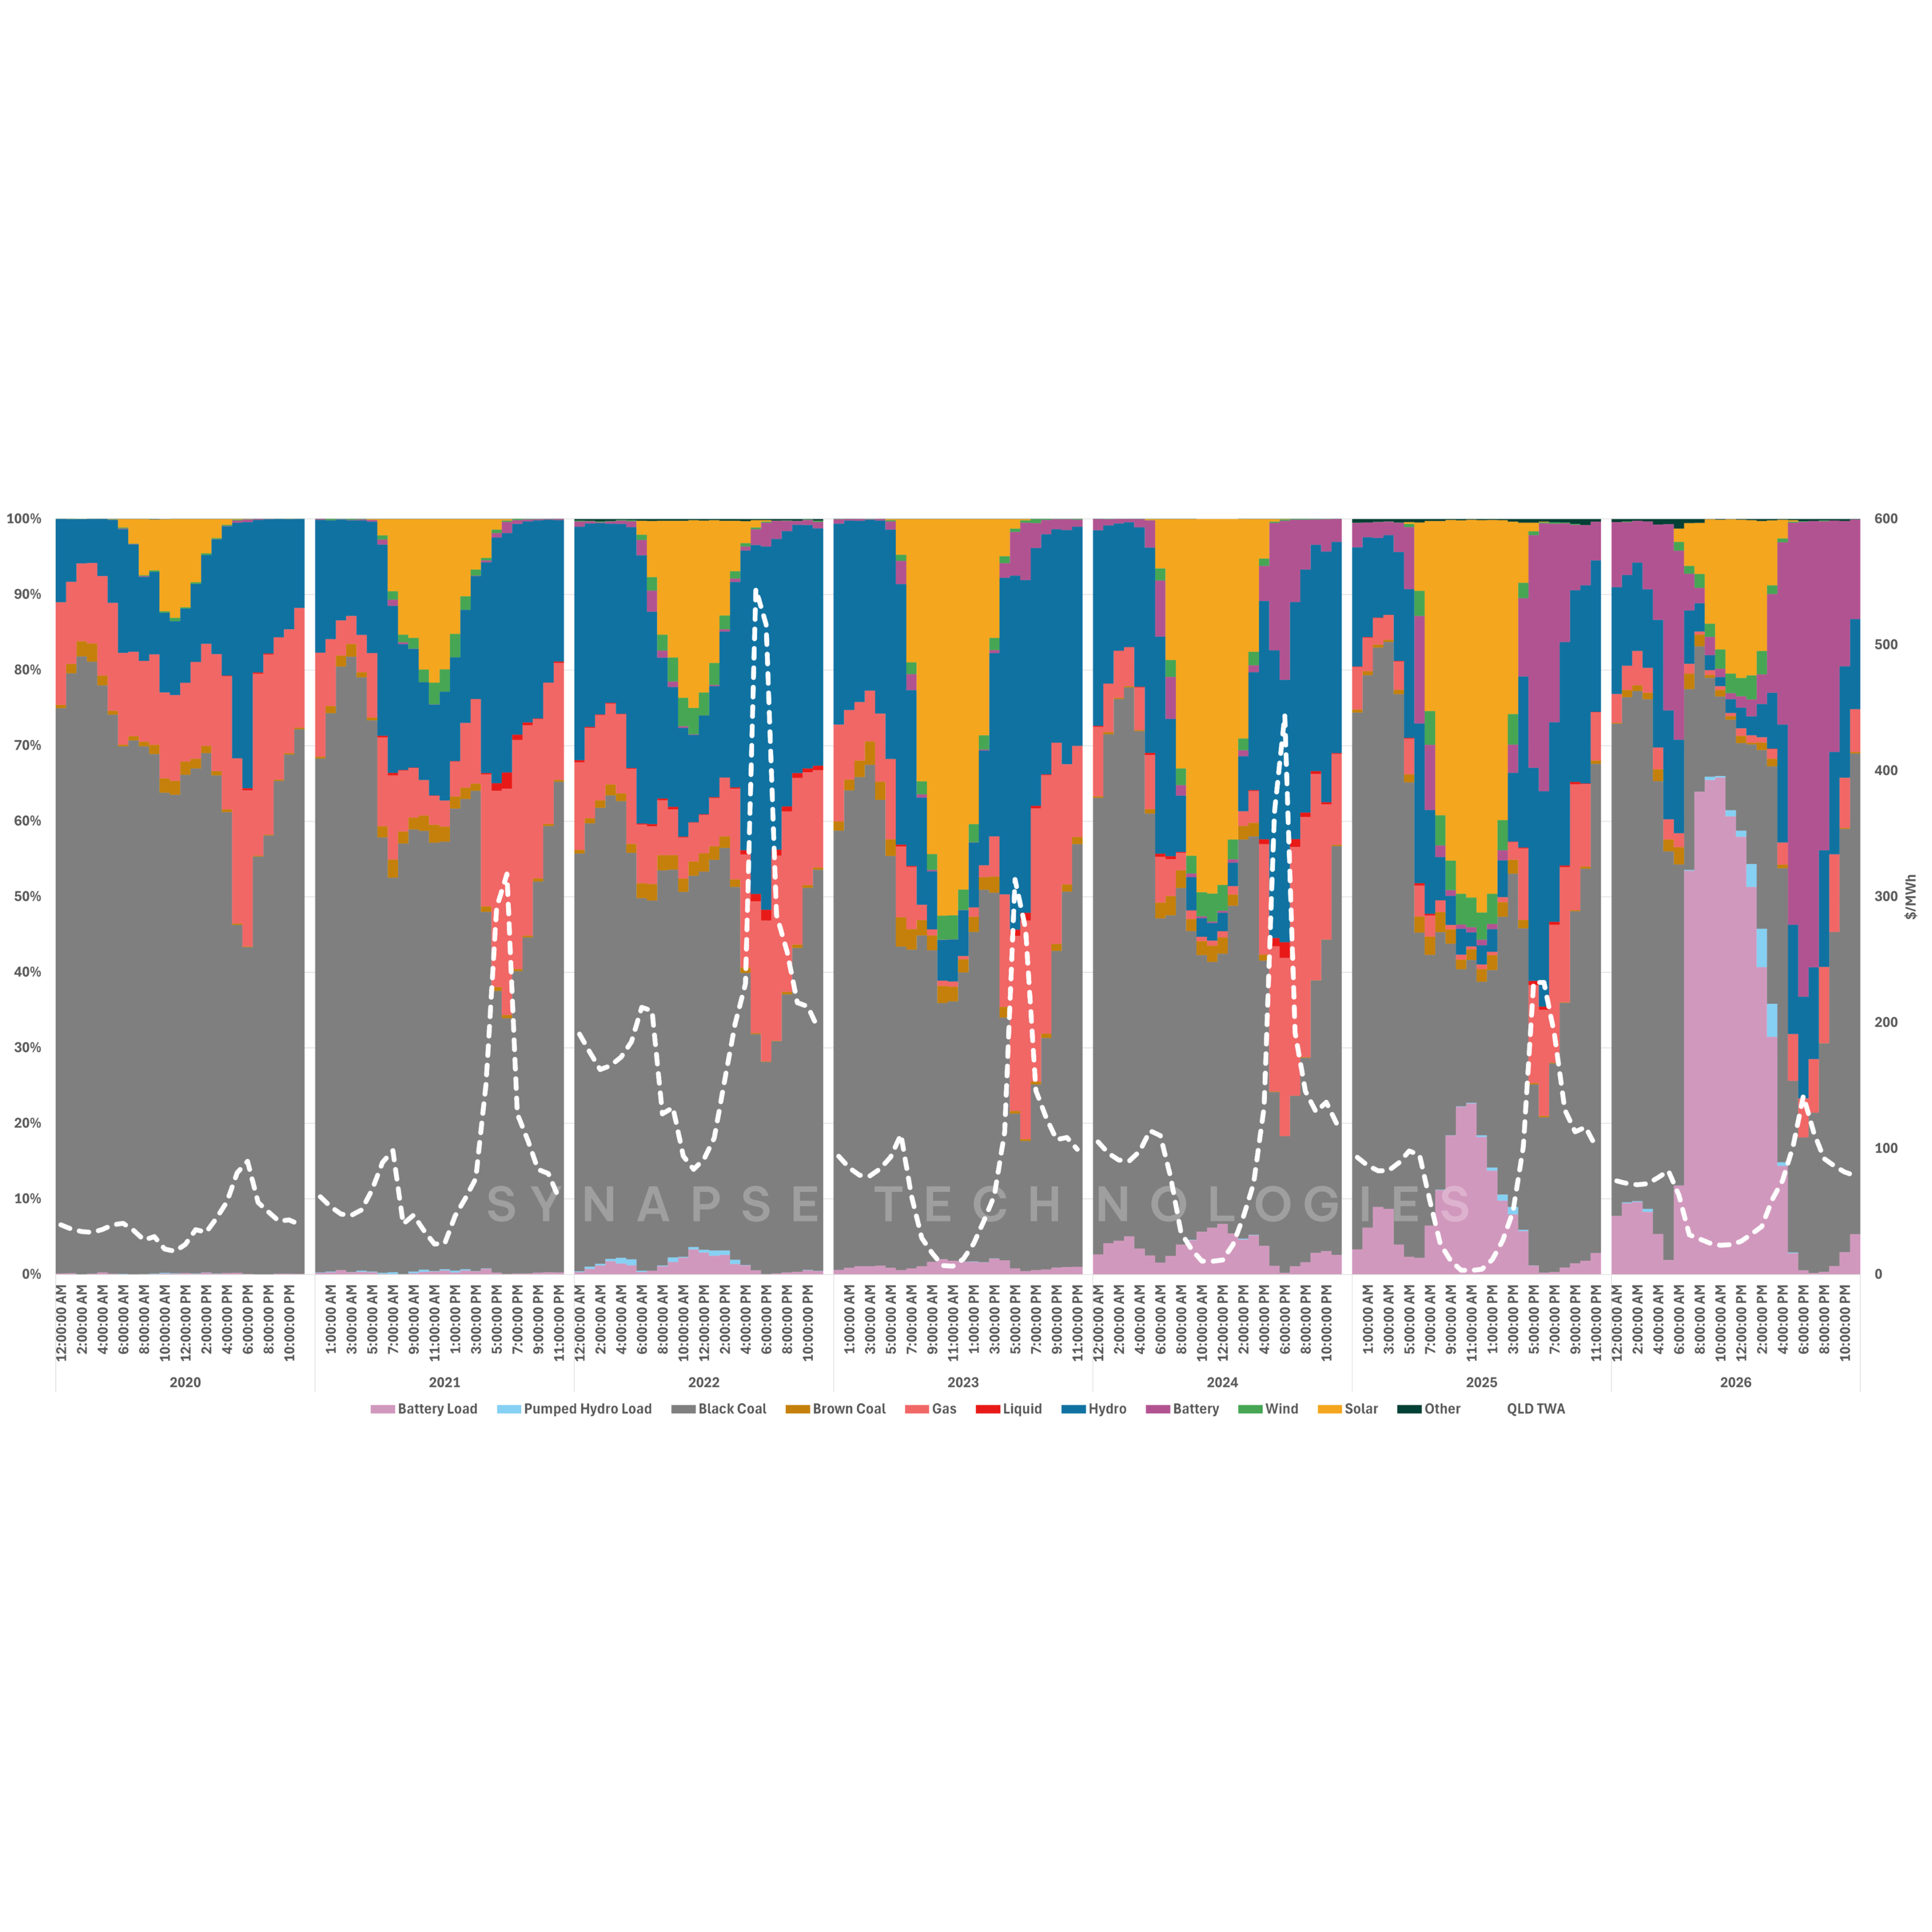
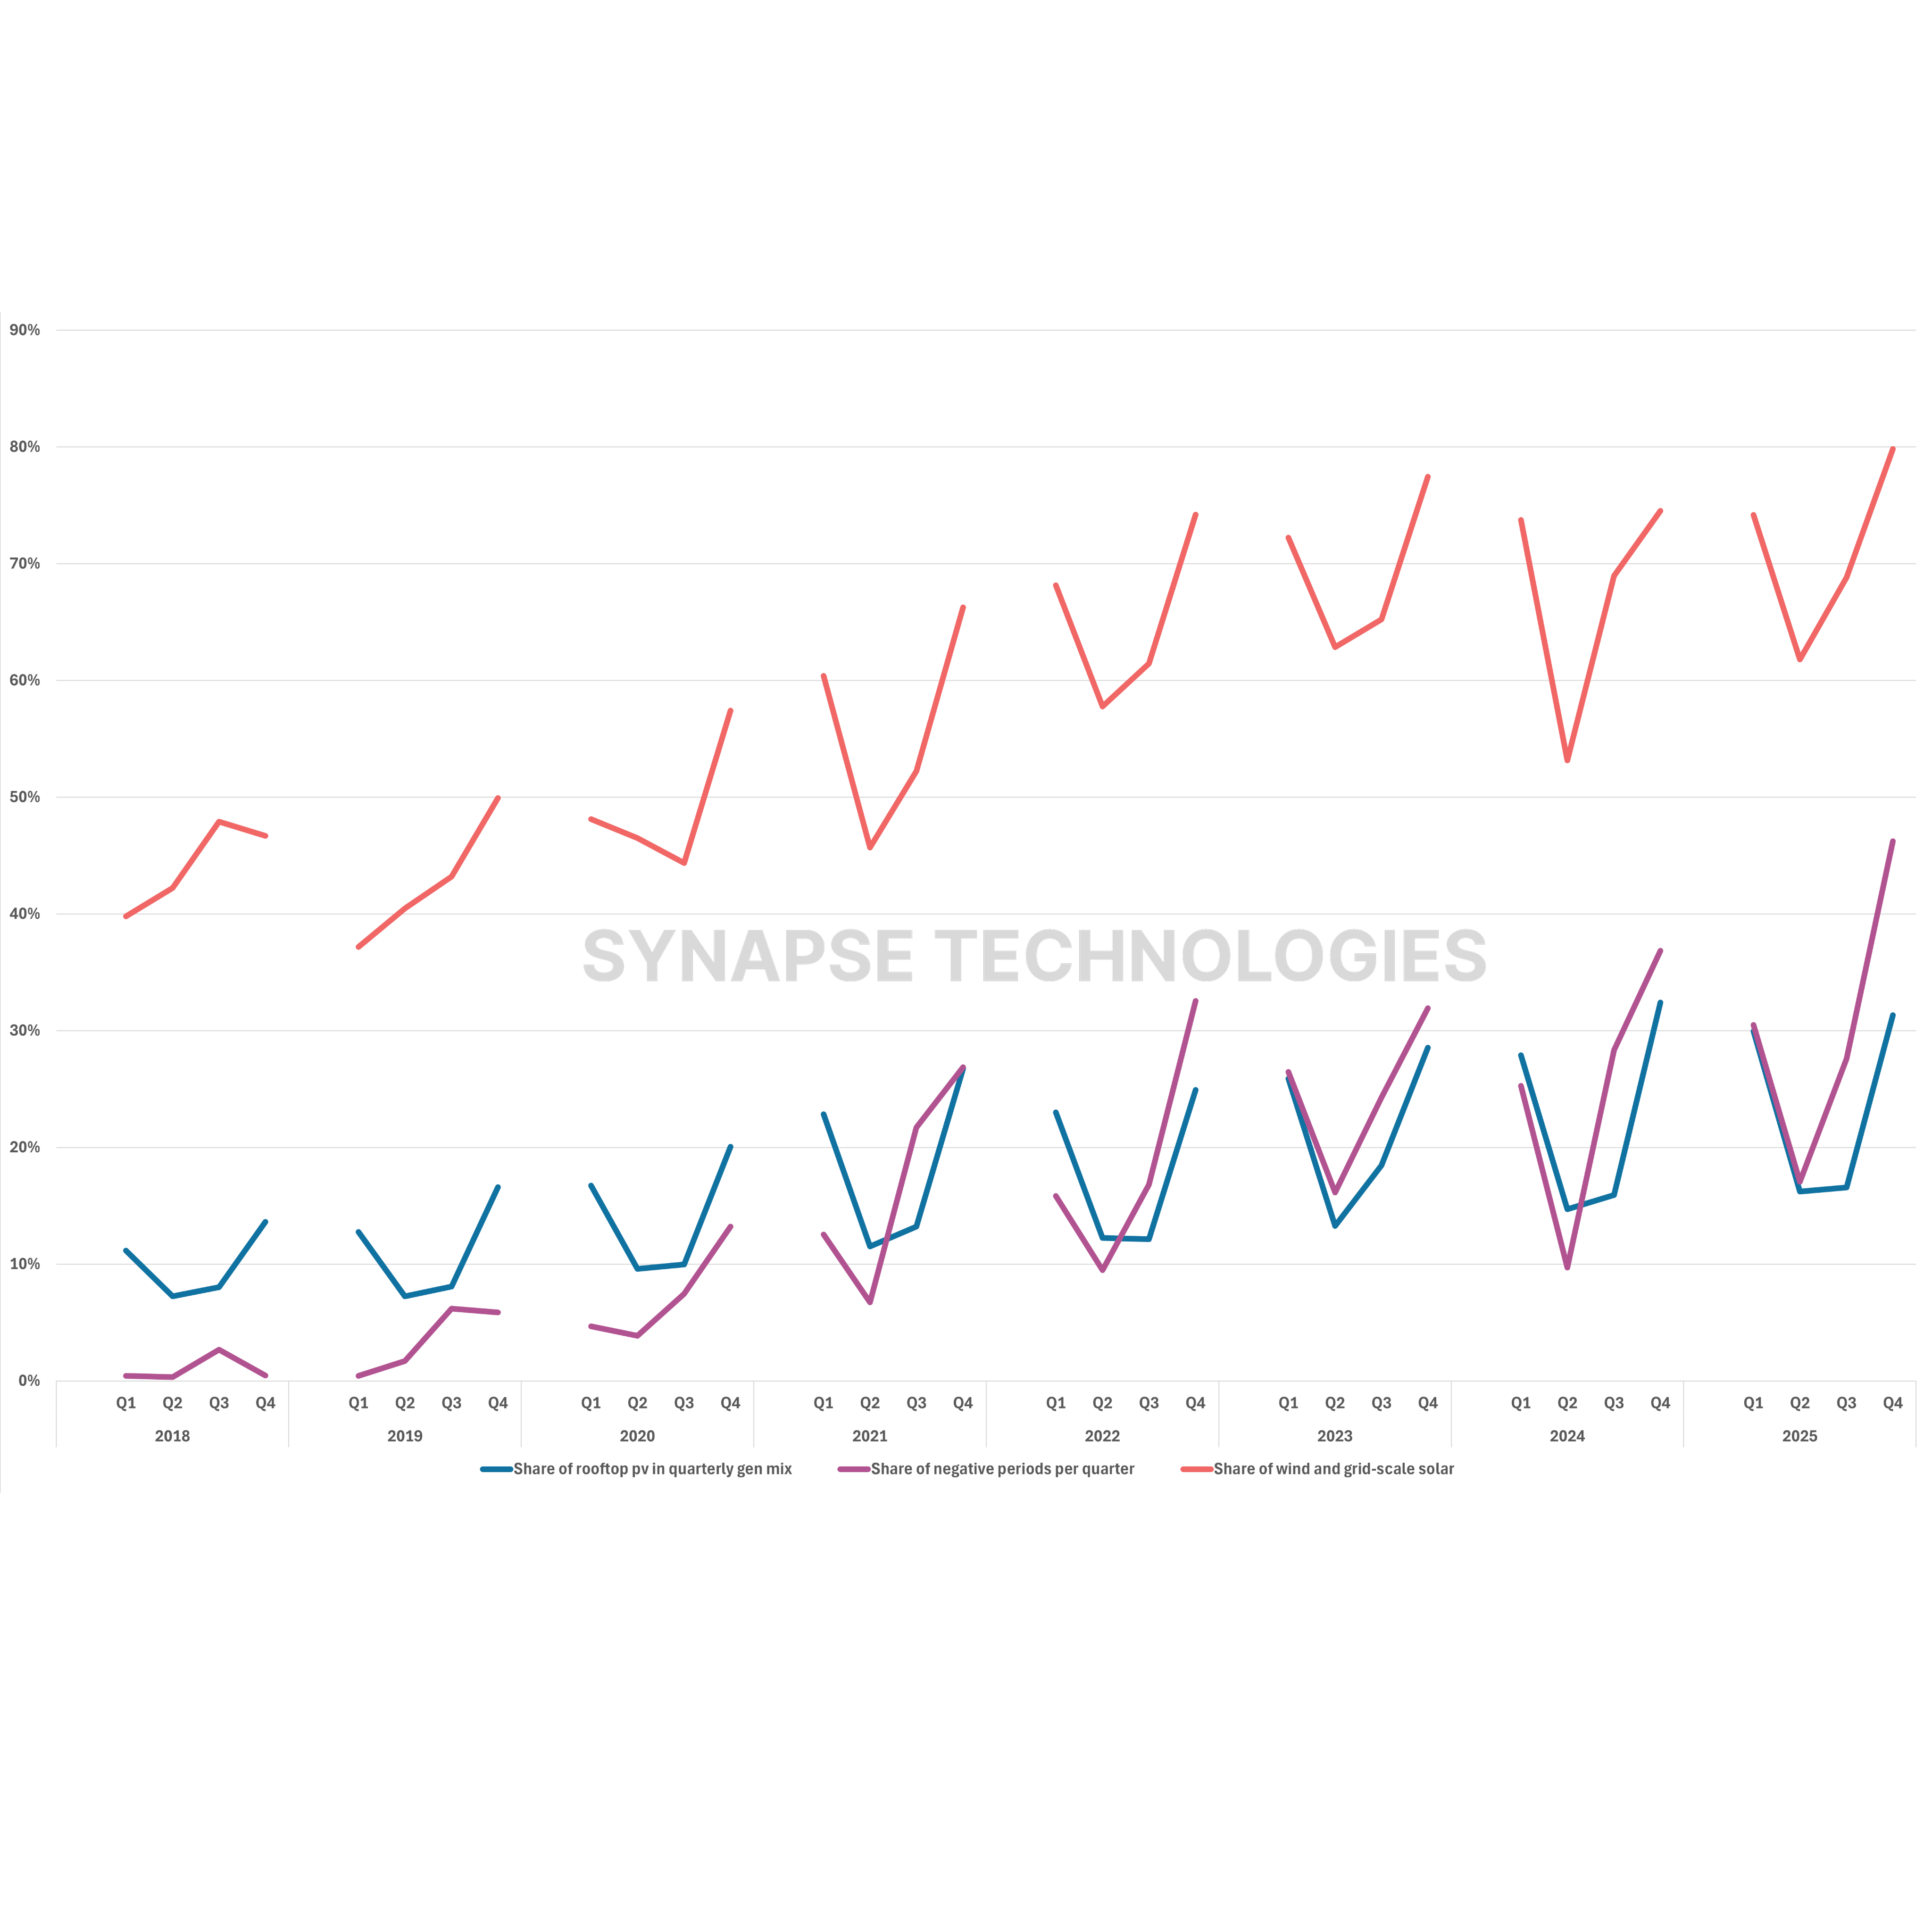
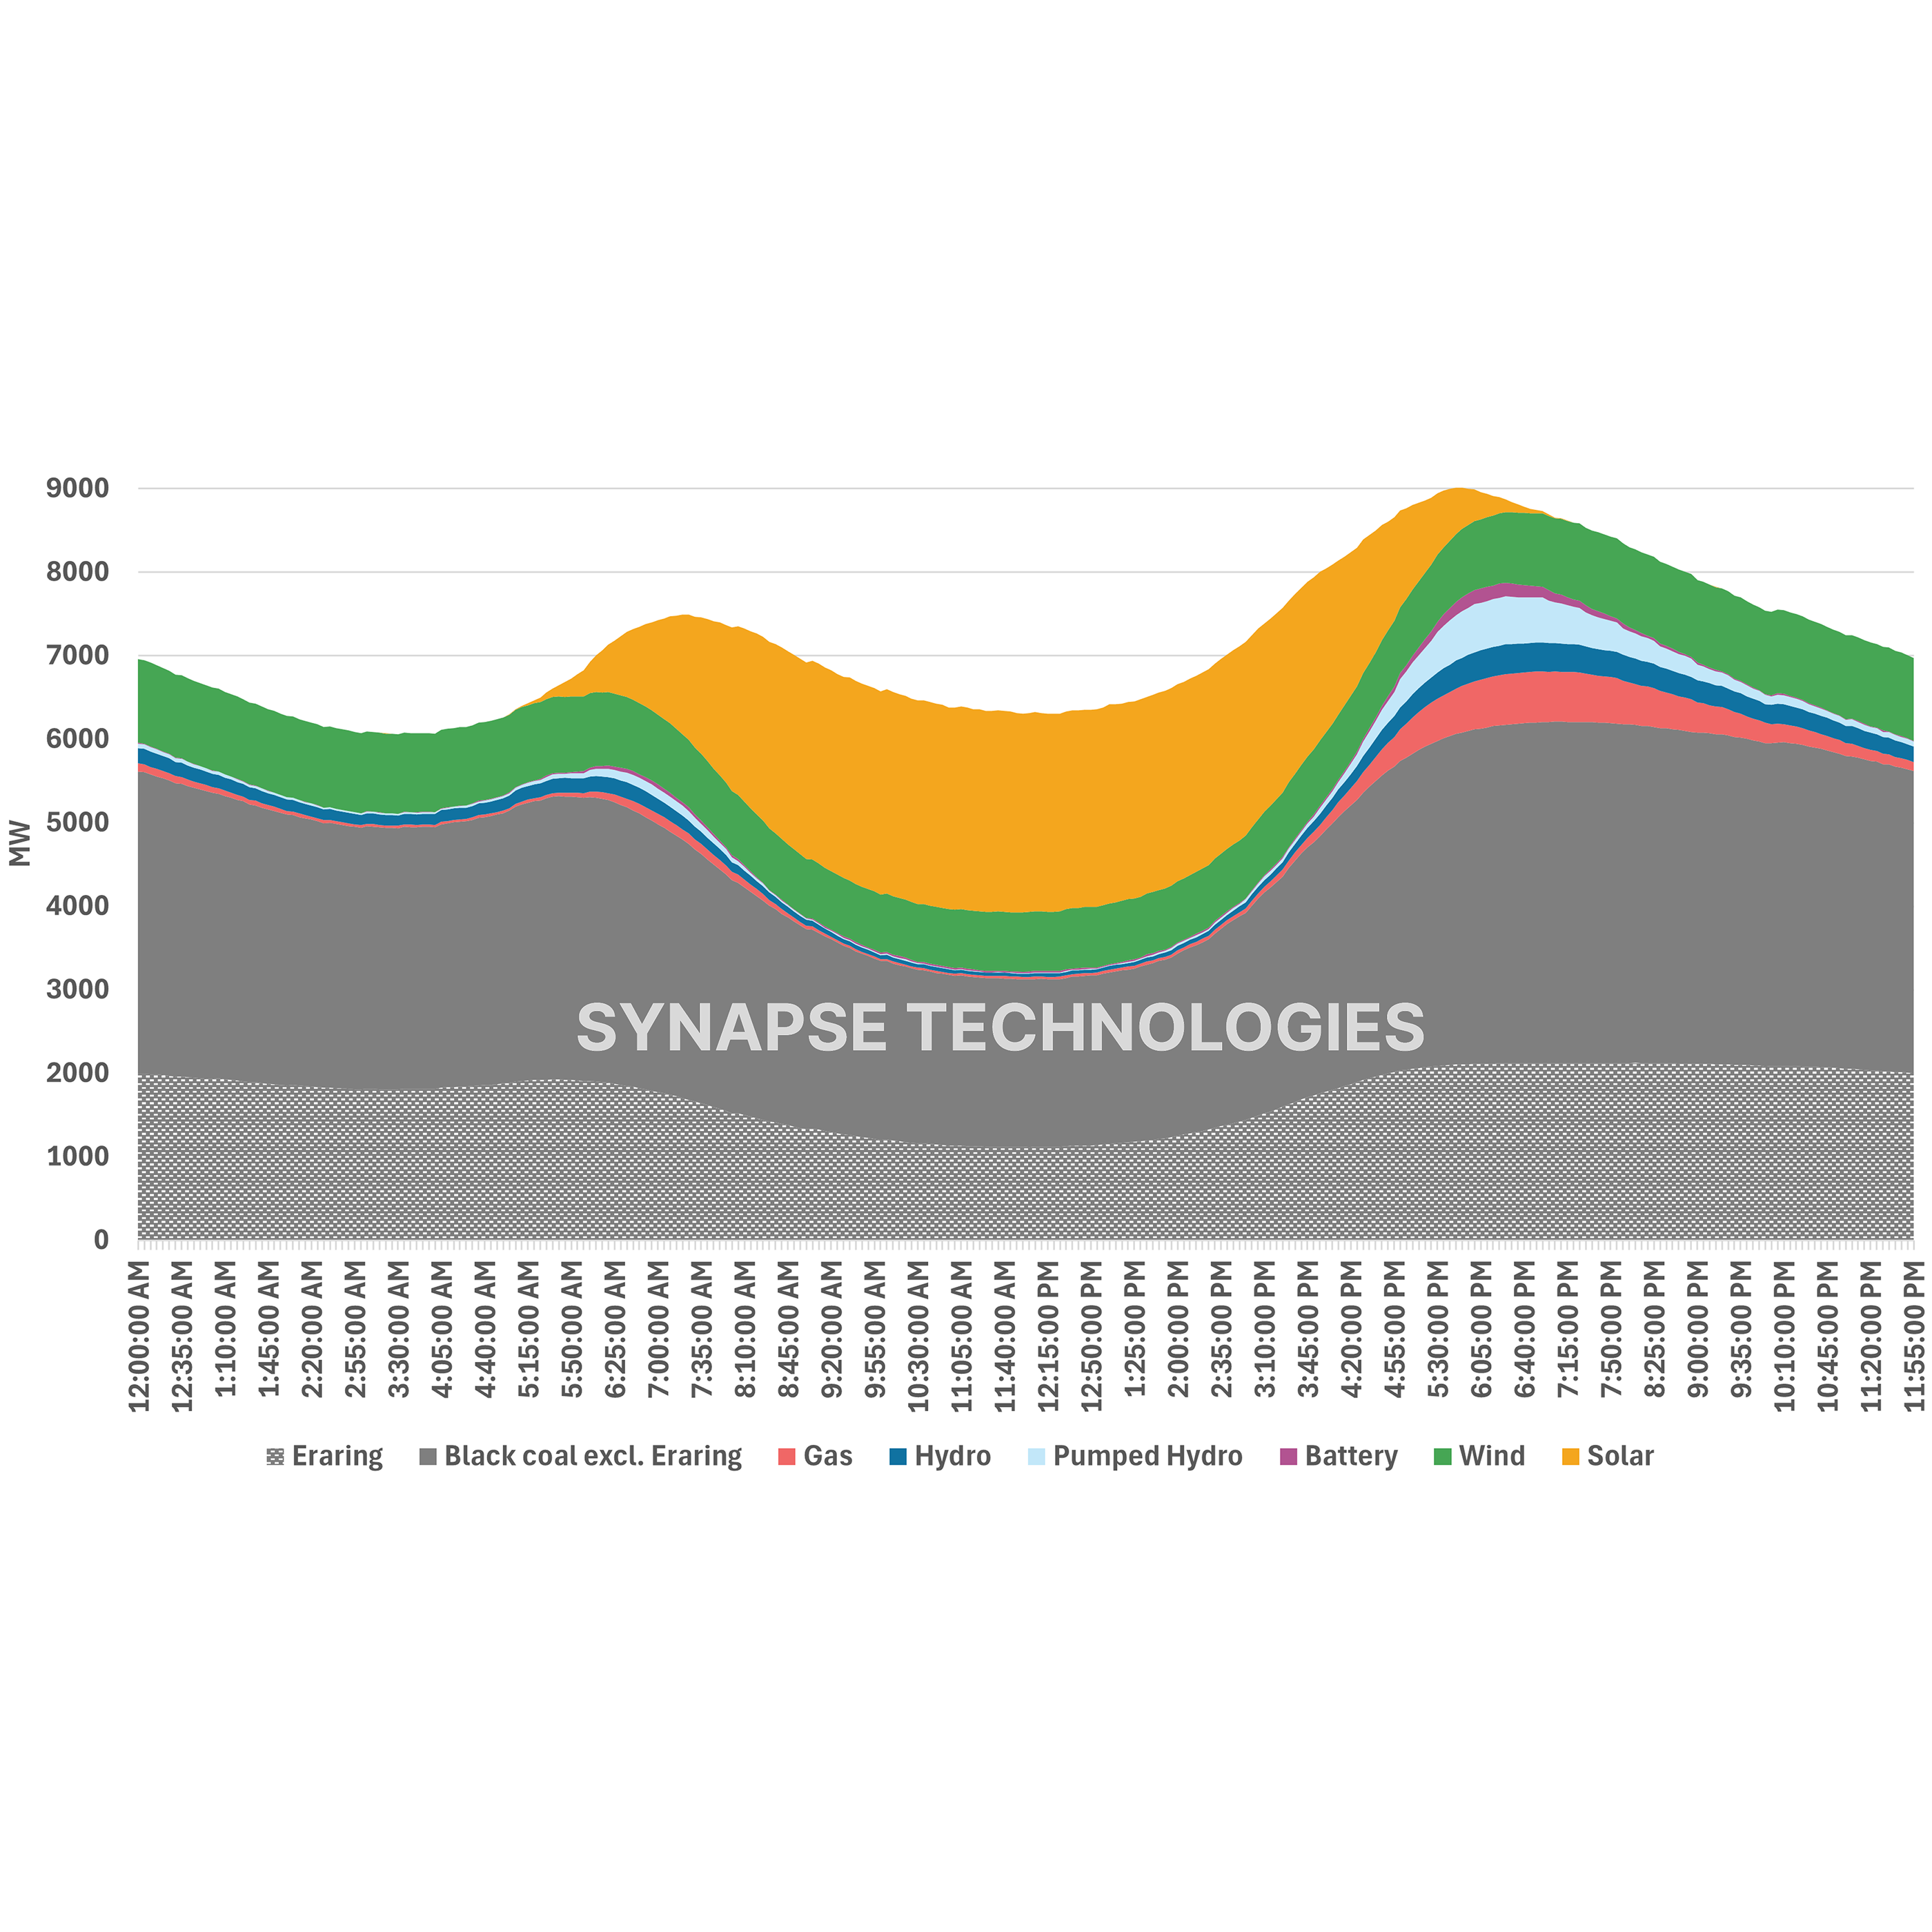
Gas generators play a specific and important role in Queensland. Although gas accounts for only 6 – 11% of total electricity generation in Queensland, it provides flexible capacity that can respond quickly, especially in the evening peak when the sun sets and demand spikes. Figure 2 highlights this role by plotting Australia’s average gas-powered generation by time of day since 2017. The chart shows a clear daily pattern: gas generation tends to ramp during morning and evening demand peaks. On average, gas generation increases from roughly 117 MW during midday periods to around 1.1 GW (2025 average) during evening peaks – a 10x ramp within five hours. This enormous swing is primarily caused by rooftop and grid scale solar displacing gas during the day – in 2017, gas was only doing a 1.5x ramp. As seen in Figure. 2, this growth in rooftop and grid solar has also had a significant impact on intraday power price volatility over the last decade. We will be deep diving into this subject in future editions.
Origin Energy sits at an interesting junction within this market structure. The company owns the 644 MW Darling Downs Power Station in Queensland and also holds a 27.5% stake in the Australia Pacific LNG (APLNG) project at Curtis Island. APLNG operates two LNG trains primarily supplying Asian markets. Origin also operates upstream gas fields and the main gas transmission pipeline to the Curtis Island liquefaction facility.
Darling Downs power station alone represents 35 – 40% of Queensland’s gas-fired generation (2025 average) and is frequently dispatched during periods when gas units help set wholesale electricity prices in the region. The station’s location is also notable. It sits within the Surat Basin gas production region and within the broader gas corridor that links LNG export facilities at Curtis Island to Wallumbilla gas supply hub – one of the east-coast’s most important gas trading and pipeline interconnection points. Wallumbilla itself connects nine major pipelines, acting as the central trading hub where domestic supply, LNG export and pipeline flows converge.
In this context, assets like Darling Downs illustrate how volatility in international LNG markets can potentially influence dispatch outcomes and pricing within the NEM, particularly during peak periods. That said, the extent to which these global gas price increases translate into higher electricity prices in Australia remains to be seen. Long-term gas contracting arrangements and other domestic supply sources provide some insulation against immediate price shocks, especially in the southern states where other gas fields such as - Otway and Gippsland in Victoria - provide diversification of supply.
The real test may come if the conflict persists into Australia’s winter. With global LNG prices likely to remain elevated during this period, pressure on east-coast gas markets would intensify. In that scenario, the ripple effects of a distant war may not remain confined to global commodity markets. Instead, they could travel through the interconnected chain linking Asian LNG markets, Queensland gas supply and the National Electricity Market (NEM), ultimately shaping electricity prices much closer to home.
Australia’s federal government is currently developing a domestic gas reservation policy which is expected to come into effect in 2027. It appears gas producers will be required to set aside 15 – 25% of extracted gas for domestic consumption. How effective will such schemes be at buffering the nation from international gas price pressures, especially in prolonged supply crises? Only time will tell.

.png)