

Anatomy of a camel curve: how home BESS is reshaping the NEM
Launched in July 2025, Australia’s federal Cheaper Home Batteries Program (CHBP) is designed to cut the upfront cost of home battery energy storage systems (BESS) and accelerate behind-the-meter (BtM) storage. After Australians’ enthusiastic uptake of the program threatened to exhaust the A$2.3 billion allocation early, the Commonwealth Government has now more than tripled the program’s budget to A$7.2 billion.
Available to households, small businesses and community organisations, the CHBP is rapidly scaling home batteries from a niche technology into a material force within Australia’s energy system. In this first edition of Watt’s the Story, we examine the rapid growth of small-scale BtM storage in the Australian National Electricity Market (NEM) and its implications.
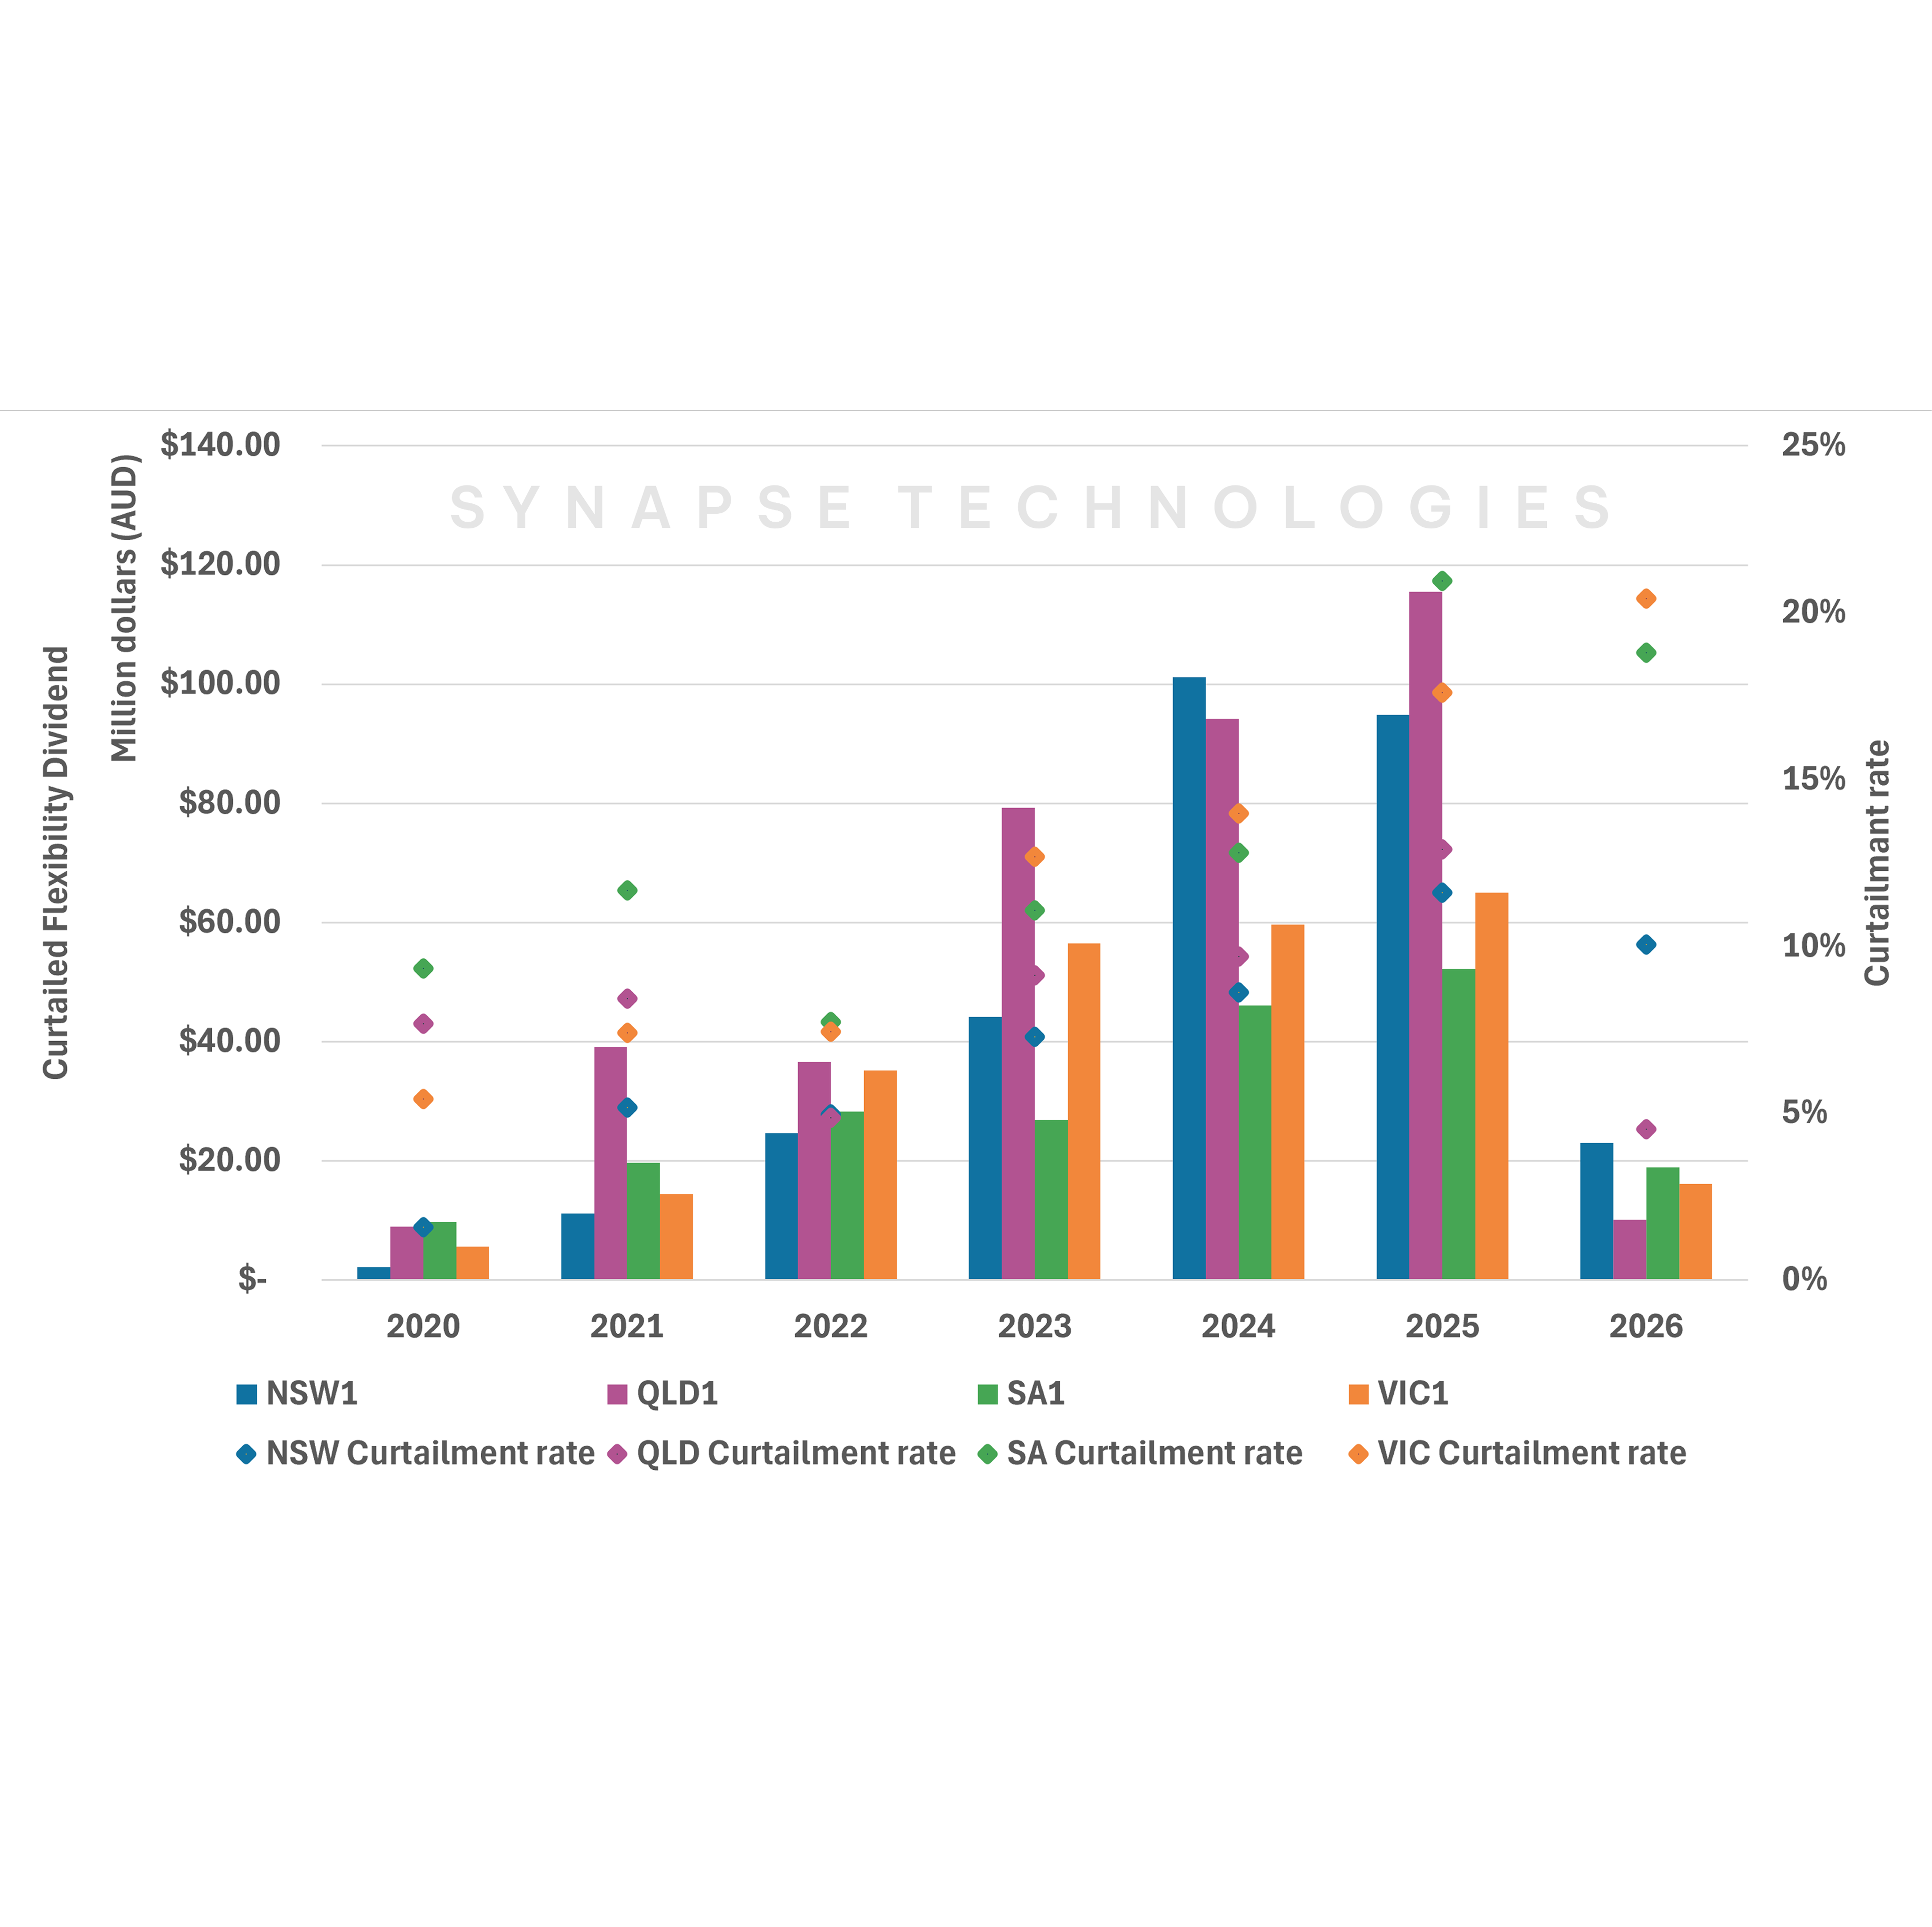
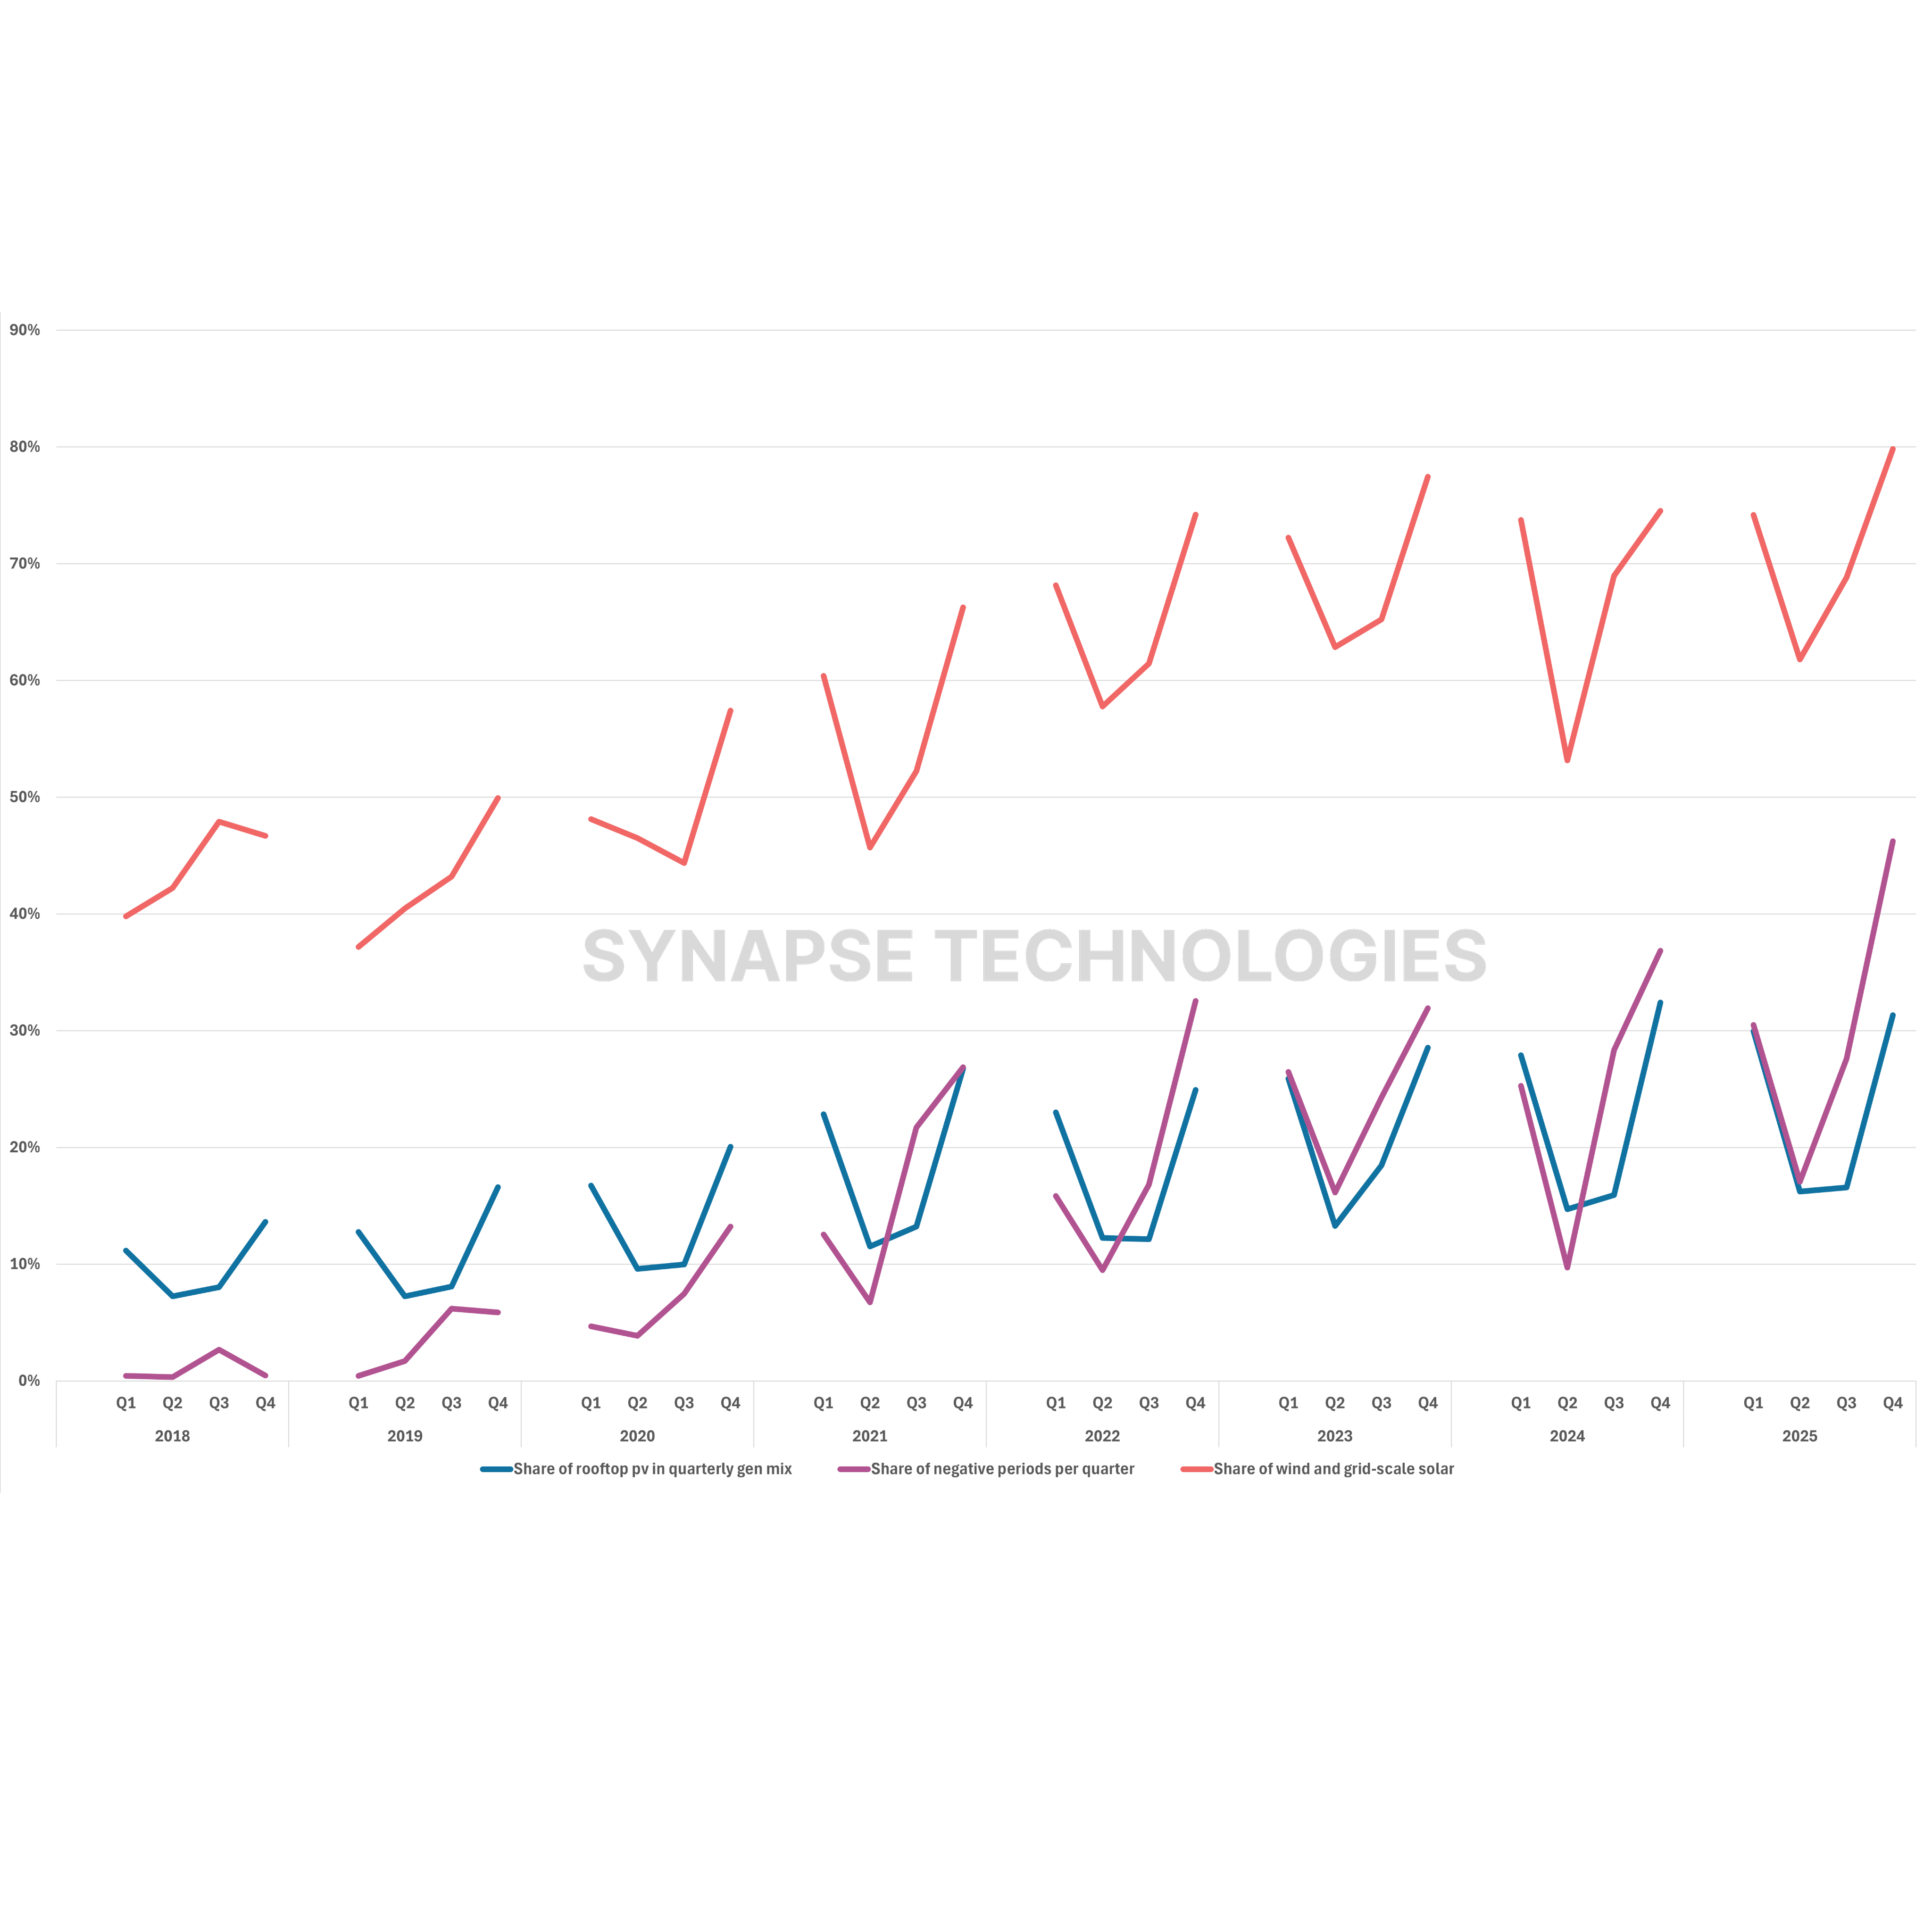
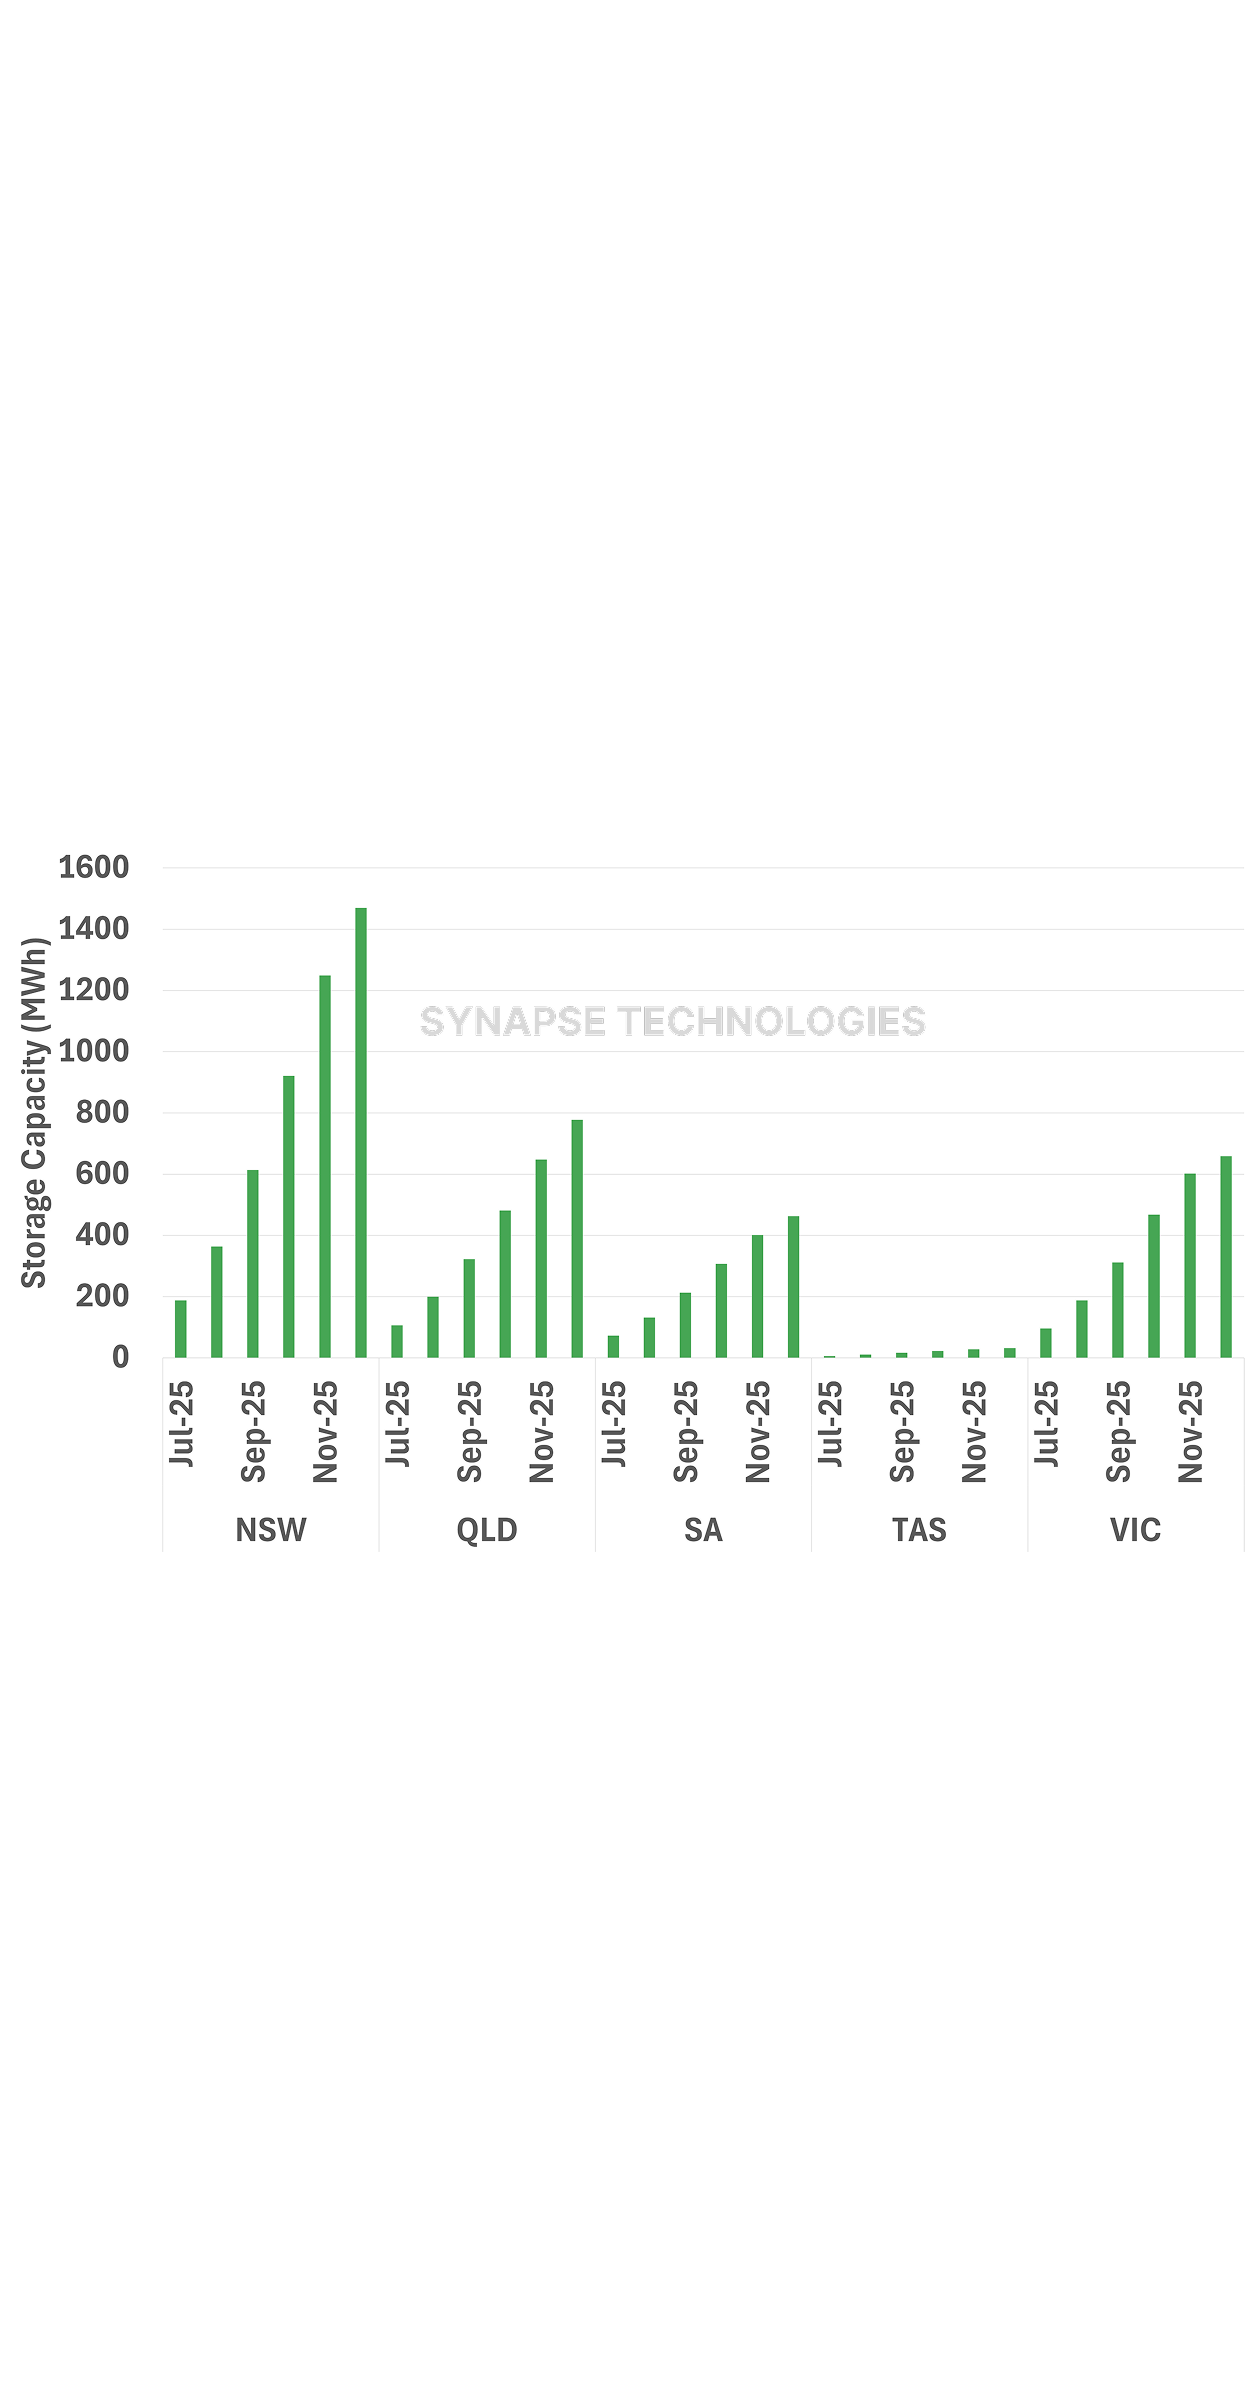
As illustrated in Figure 1, household BESS and small-scale BtM storage has soared across the NEM. In the first six months of CHBP, capacity grew from virtually nothing to between 500 – 1,500 MWh across all mainland states. NSW led this growth with an almost eightfold increase. This rate is reminiscent of Australia’s rooftop solar uptake, in which installations increased by 3x to 4x across all mainland states between 2017 and 2023. Given the profound impact rooftop solar uptake has had on the NEM – most notably through the emergence of the “duck curve” – the question now becomes what impacts will hyper-accelerated home BESS and small-scale BtM storage have on the NEM?
Recognising that home battery operating periods will likely coincide with evening peaks, we have assessed their ‘theoretical peak coverage’ to examine potential system impacts. Calculated for all NEM states, this metric represents the maximum share of peak demand that could be supplied under a simple two-hour discharge assumption. We presume batteries are fully charged, noting that many systems appear oversized relative to current rooftop solar capacity and may take time to reach full utilisation.
As shown in Table 1, small-scale BtM storage could have theoretically supplied around 4–8% of peak load across all mainland states in December – a month typically with above-average demand. To put this in perspective, within just six months of the CHBP, home batteries could theoretically cover a bigger portion of the December peak load than Vales Point's coal plant (5%) and just under half of the contribution made by Eraring (15%) – the largest coal-fired power station in NSW. These figures become even more pronounced in SA in November, in which lower overall demand means that home batteries could theoretically supply as much as 11% of the peak load, a staggering outcome.

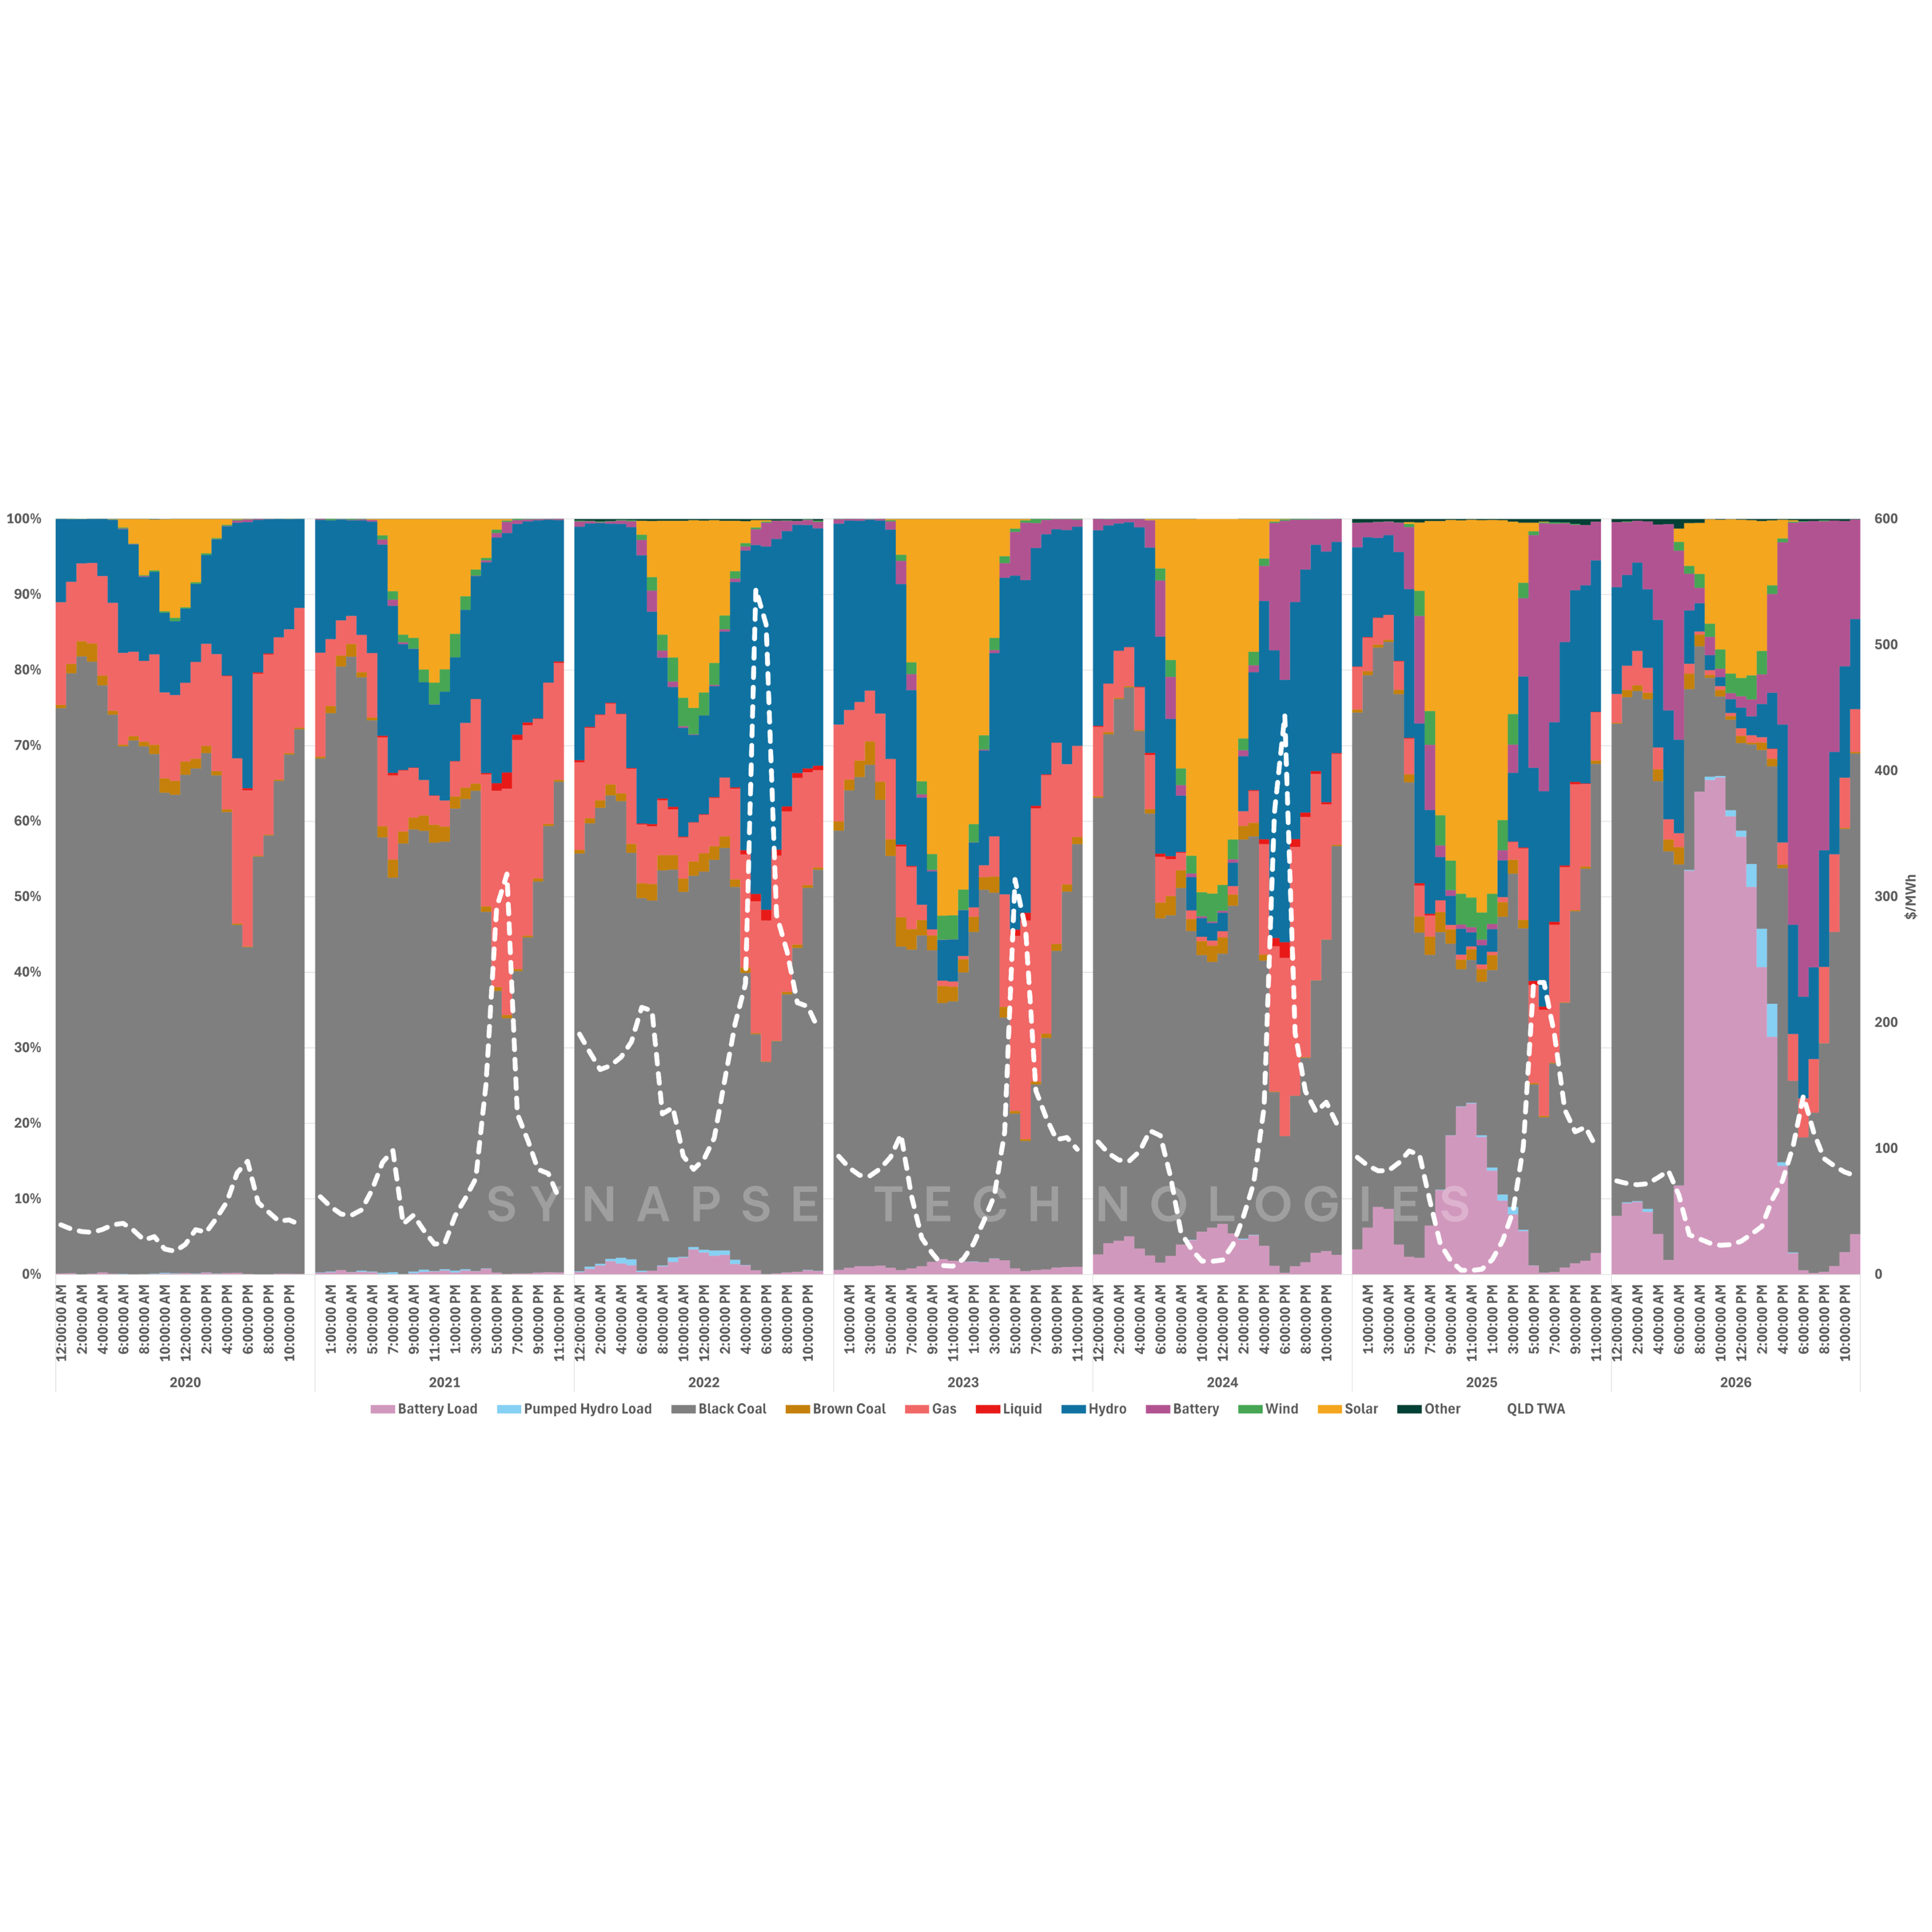
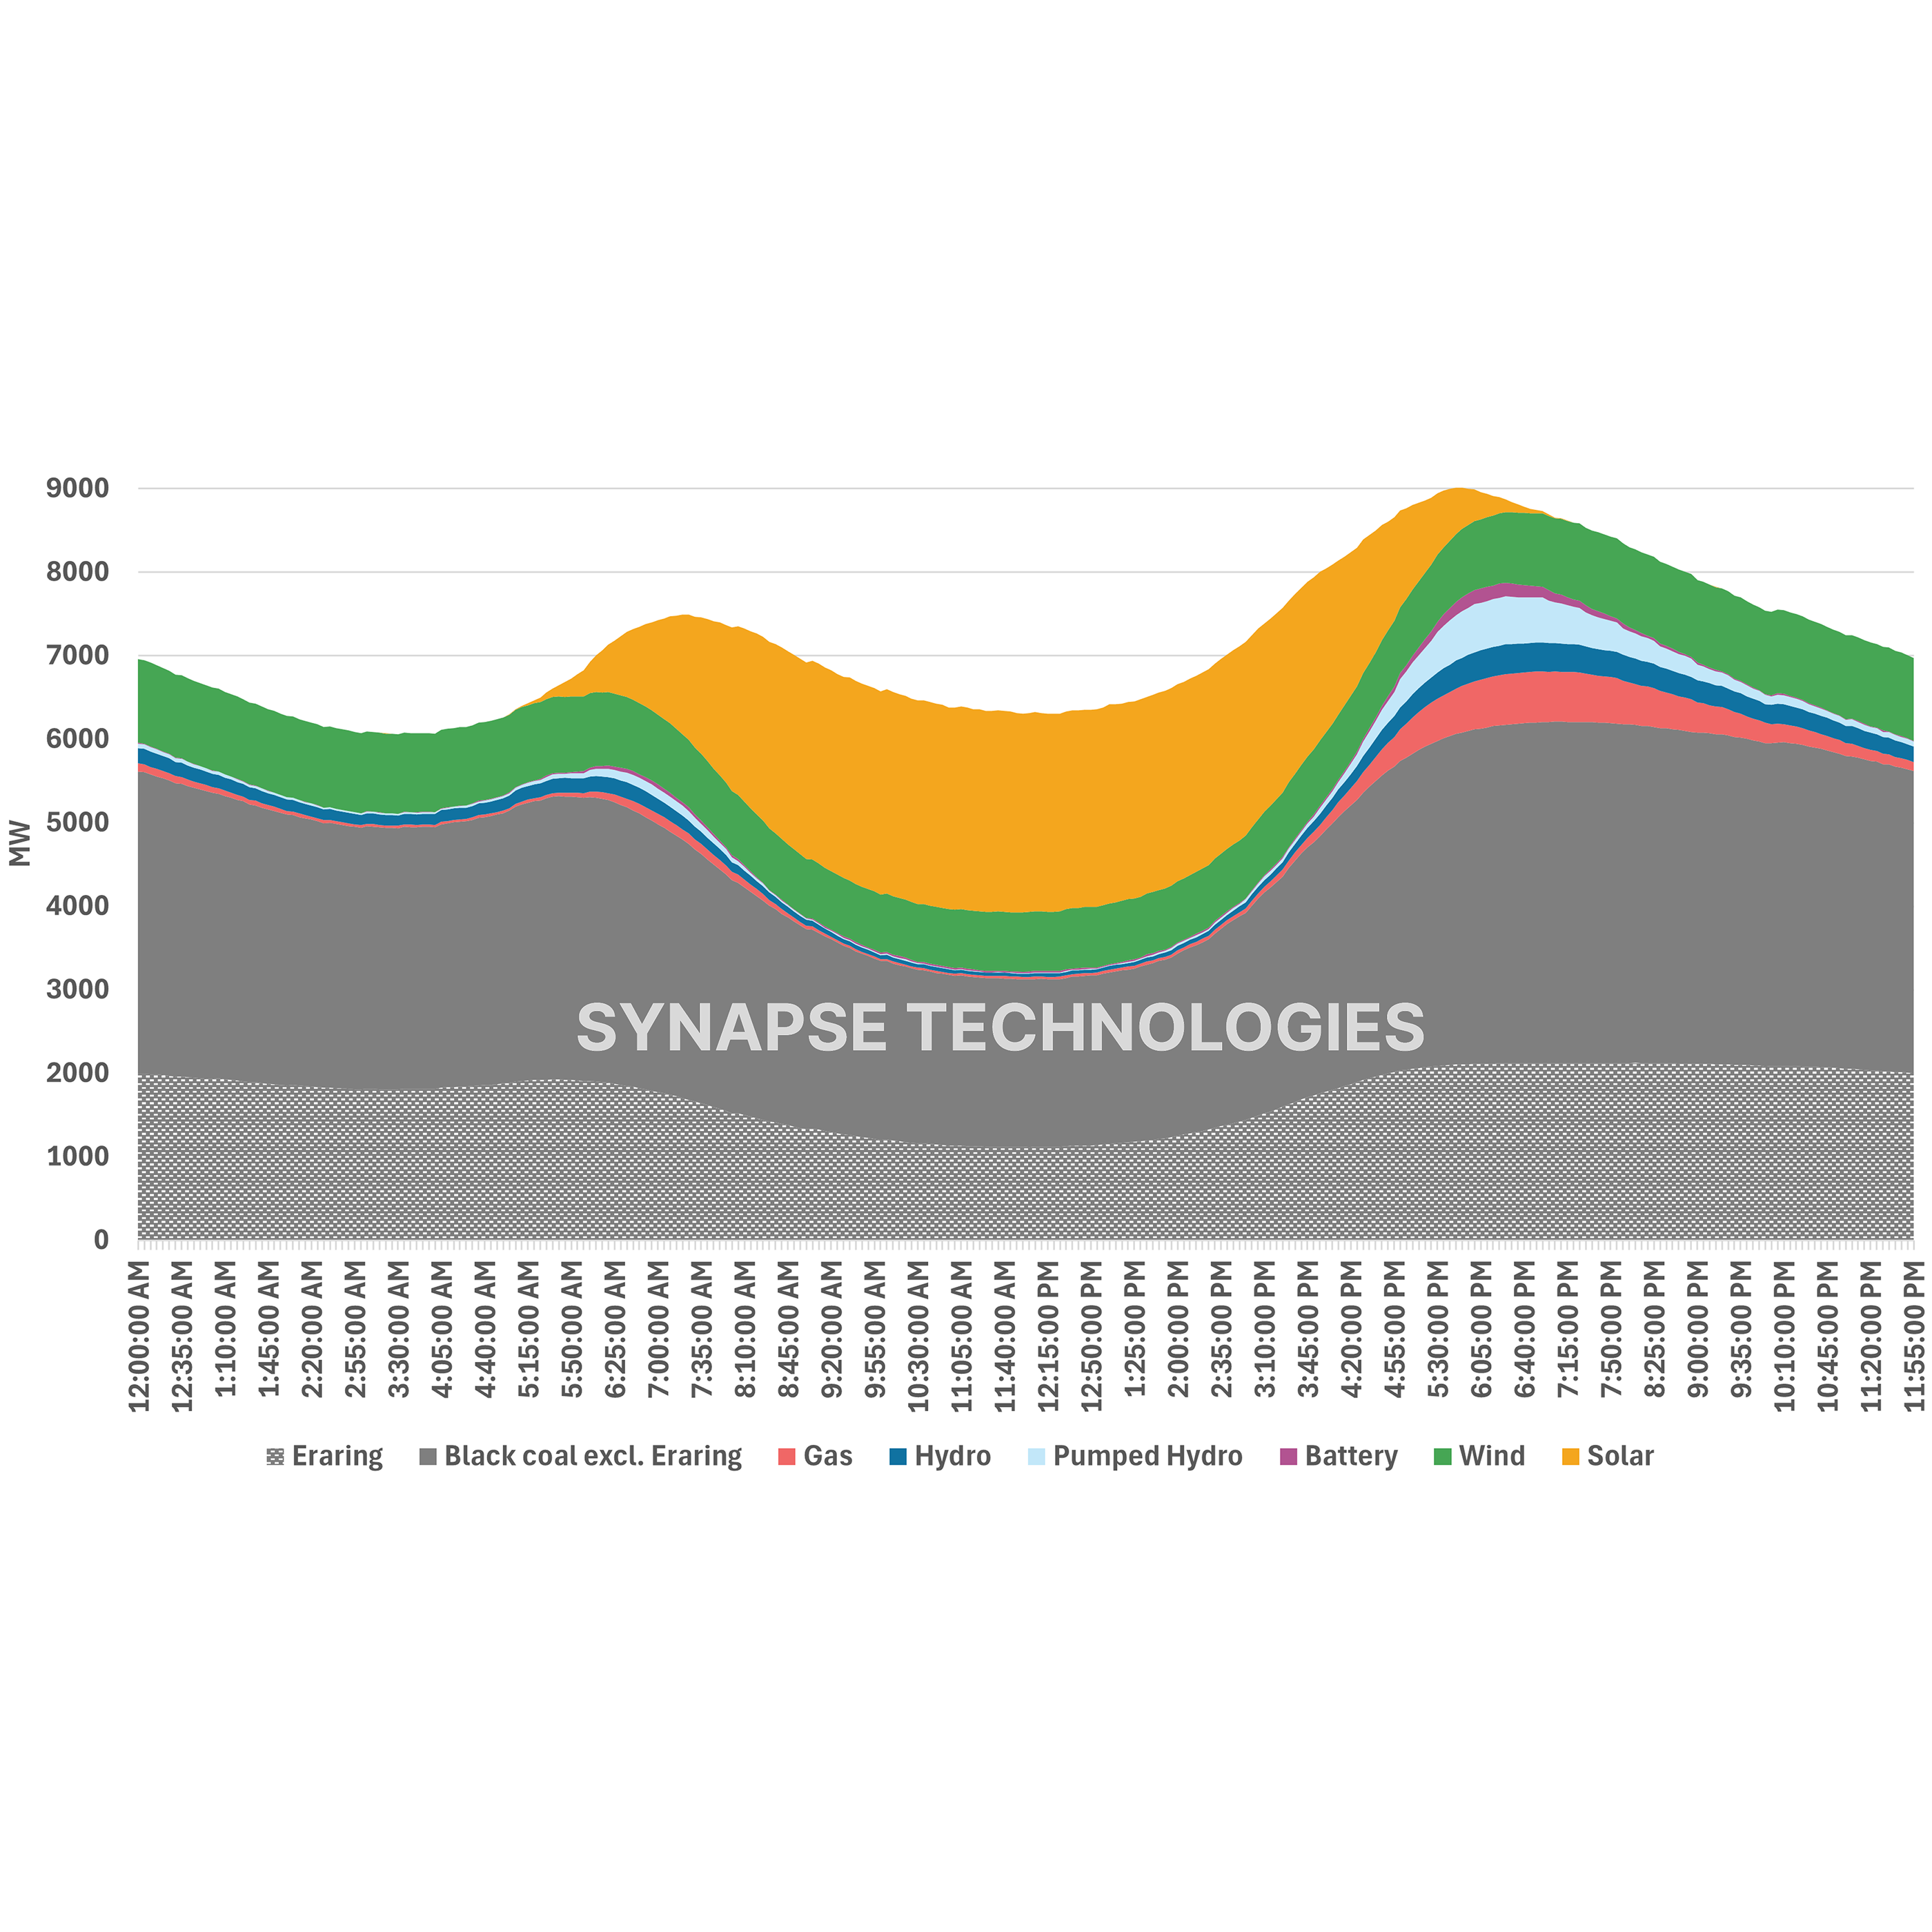
.png)
Evolving from the rooftop-solar-driven “duck curve” observed in the NEM and globally – could the NEM now be on the cusp of a “Bactrian camel curve” era, where small-scale BtM storage splits the evening peak? That is, will BtM batteries flatten the early-evening demand ramp, staggering the return of grid demand until later in the evening once home batteries are spent? If so, this could produce a demand curve with two smaller humps - a shape that carries significant market implications. For instance, will this cannibalise wind revenues and arbitrage opportunities for utility-scale batteries? While small-scale BtM batteries could soften demand variance, NSW is notably expecting a wave of coal retirements over the coming years. This may mean that rather than cannibalizing returns, BtM storage may end up plugging a supply hole within a hot market. We will be exploring these topics in future, stay tuned.
As it stands, small-scale BtM storage is already reshaping load profiles in the NEM. With Australia’s government targeting 40 GWh of small-scale storage installations by 2030, the NEM will undoubtedly be a dynamic, complex place over the coming years requiring sophisticated planning and forecasting platforms like Amplink.

.png)